Figure 1.
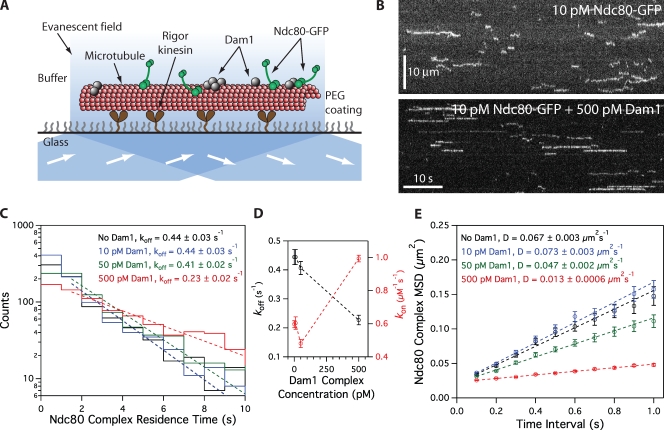
Dam1 complex enhances binding of individual Ndc80 complexes to microtubules. (A) Schematic of the TIRF assay developed to visualize the behavior of GFP-tagged Ndc80 complexes (green rods) in the presence of untagged Dam1 complexes (gray spheres) on microtubules. (B) Representative kymographs showing the binding and one-dimensional diffusion of 10 pM Ndc80 complexes on taxol-stabilized microtubules in the absence or presence of 500 pM Dam1 complex. Positions along the microtubule are shown on the vertical axis, whereas the passage of time is depicted along the horizontal axis. Concentrations are of free complexes in solution. (C) Residence time distributions of 10 pM Ndc80 complex on microtubules without Dam1 complex (black histogram; n = 883 events), with 10 pM Dam1 complex (blue histogram; n = 966), 50 pM Dam1 complex (green histogram; n = 928), and 500 pM Dam1 complex (red histogram; n = 1,003). Dotted lines show the weighted exponential fits used to determine dissociation rate constants, koff. (D) Dissociation rate constants (koff; left axis, black markers) for the Ndc80 complex, calculated from the data in C, are plotted against the concentration of Dam1 complex. Association rate constants (kon; right axis, red markers) of the Ndc80 complex are also plotted (without Dam1 complex, n = 1,103; with 10 pM Dam1 complex, n = 1,426; with 50 pM Dam1 complex, n = 1,179; with 500 pM Dam1 complex, n = 1,412). (E) Mean-squared displacement (MSD) is plotted against time for 10 pM Ndc80 complex on microtubules without Dam1 complex (black markers; n = 803 events), with 10 pM Dam1 complex (blue markers; n = 859), 50 pM Dam1 complex (green markers; n = 883), and 500 pM Dam1 complex (red markers; n = 968). Dotted lines show the weighted linear fits used to determine diffusion constants, D. Markers indicate SEM.

