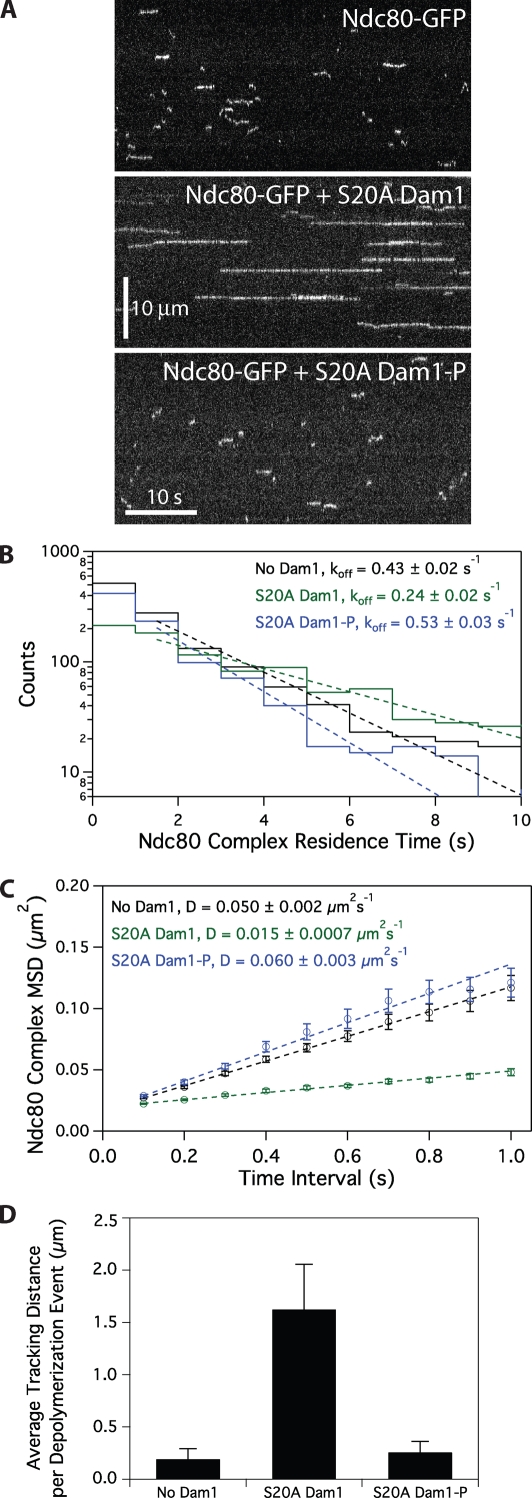
Figure 7.
Ipl1 phosphorylation of the Dam1 complex regulates its interaction with the Ndc80 complex. (A) Representative kymographs showing changes in behavior of 10 pM Ndc80 complex with the addition of 500 pM S20A Dam1 complex with or without Ipl1 phosphorylation. Concentrations are of free complexes in solution. (B) Residence time distributions of 10 pM Ndc80 complex on microtubules without Dam1 complex (black histogram, n = 1,266 events), with 500 pM S20A Dam1 complex (green histogram, n = 1,081), and 500 pM Ipl1-phosphorylated S20A Dam1 complex (blue histogram, n = 974). Dotted lines show the weighted exponential fits used to determine dissociation rate constants, koff. (C) Mean-squared displacement (MSD) is plotted against time for 10 pM Ndc80 complex on microtubules without Dam1 complex (black markers, n = 1,102), with 500 pM S20A Dam1 complex (green markers, n = 1,030), and with 500 pM Ipl1-phosphorylated S20A Dam1 complex (blue markers, n = 860). Dotted lines show the weighted linear fits used to determine diffusion constants, D. (D) Mean tracking distance of 100 pM Ndc80 complex per depolymerization event in the absence of Dam1 complex (n = 19), in the presence of 500 pM S20A Dam1 complex (n = 28), or in the presence of 500 pM Ipl1-phosphorylated S20A Dam1 complex (n = 39). Error bars indicate SEM.

