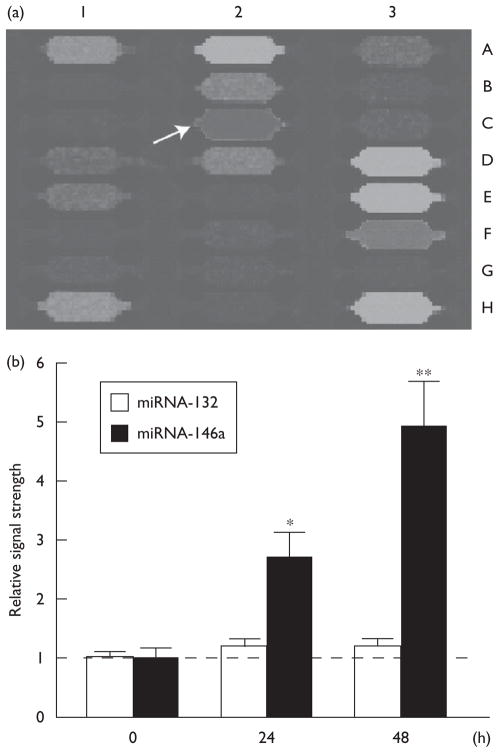
Fig. 2.
(a) Specific upregulation of miRNA-146a (coordinate 2C) on miRNA array panels and (b) signal quantitation of miRNA Northern dot blots. Individual miRNA panels were probed with total miRNA obtained from control and herpes simplex virus type-1 (HSV-1)-infected human neural (HN) cells (48 h) (a) and the results were compared; by convention, blue fluorescence indicates no expression detected and green-brown fluorescence indicates nonsignificant changes compared with controls. Column 1A–1H represents eight hybridization controls whose identity can be found at www.lcsciences.com; other miRNA signals are for miRNA-144 (2A), miRNA-145 (2B) miRNA-146b (2D), miRNA-147 (2E), miRNA-148a (2F), miRNA-148b (2G), miRNA-149 (2H). Those miRNAs that were detected in HN cells, but whose relative signal strength neither increased nor decreased significantly after HSV-1 infection were miRNA-200b (3D), miRNA-200c (3E), miRNA-202 (3F) and miRNA-203 (3H). (b) N=4; significance over ‘0’ time controls; *P<0.05; **P<0.01 (analysis of variance). miRNA, microRNA.

