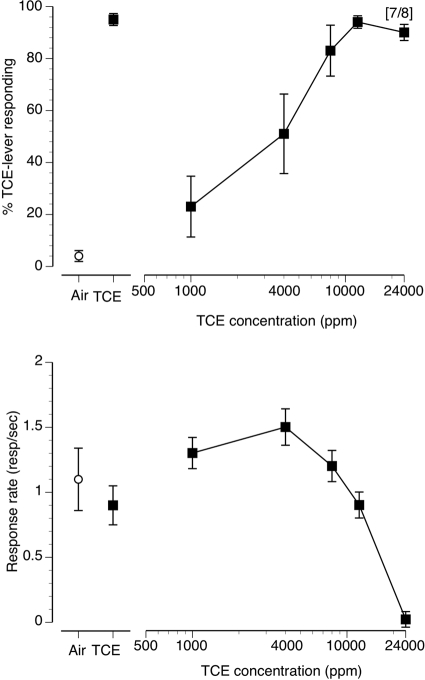
Fig. 1.
Concentration-effect curve for inhaled TCE vapor in mice (n = 8) trained to discriminate 10 min of exposure to 12,000 ppm inhaled TCE from air. The data presented are the first minute of each 5-min test session. Points above Air and TCE represent the results of air (○) and 12,000 ppm inhaled TCE (■) exposure control sessions. Top, mean (± S.E.M.) percentages TCE-lever responding are shown. Bottom, mean (± S.E.M.) response rates in responses/s are shown.

