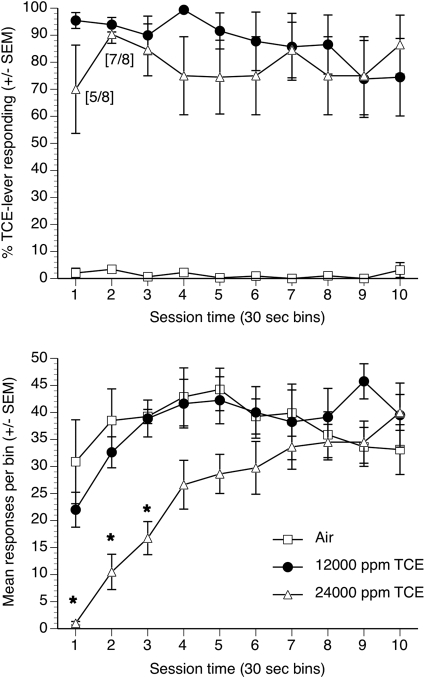
Fig. 2.
Percentages TCE lever selection (top) and operant responses (bottom) after exposure to air, 12,000 ppm TCE, or 24,000 ppm TCE in eight mice. Each point represents mean data (± S.E.M.) from each of 10 successive 30-s bins over the entire 5-min discrimination test session. *, significant suppression of operant responding (p < 0.05) compared with air exposure.

