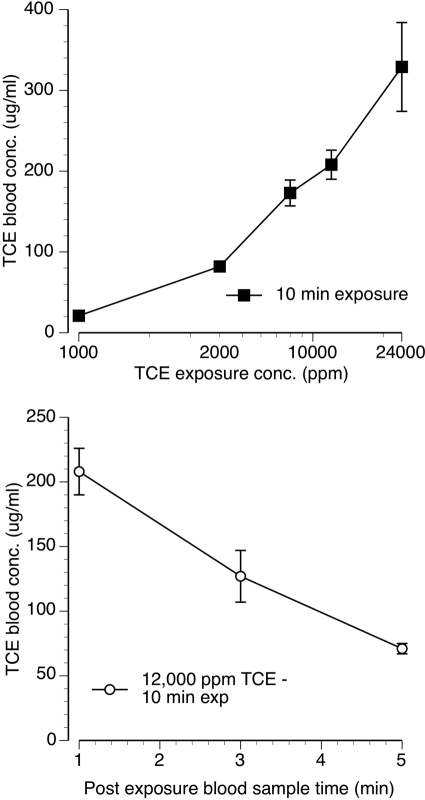
Fig. 3.
Top, mean (± S.E.M.) TCE blood concentrations measured immediately after termination of 10 min of exposure to 4000, 8000, 12,000, and 24,000 ppm TCE vapor. Bottom, mean (± S.E.M.) TCE blood concentrations measured at 1, 3, and 5 min after the termination of 10 min of exposure to 12,000 ppm TCE vapor. Each point represent data from three to four mice.

