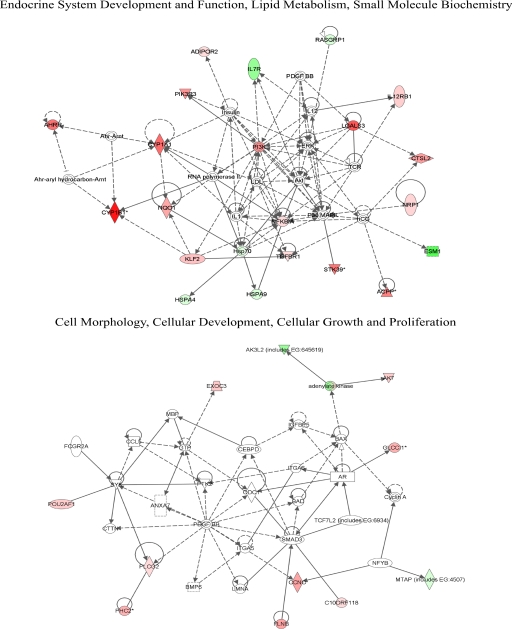
Fig. 5.
Top implicated biological networks containing genes significantly changed by TCDD exposure. Expression values are overlaid in green (decreased) or red (increased). For conventions and symbols, refer to Ingenuity website legend description (https://analysis.ingenuity.com/pa/info/help/help.htm#legend.htm).

