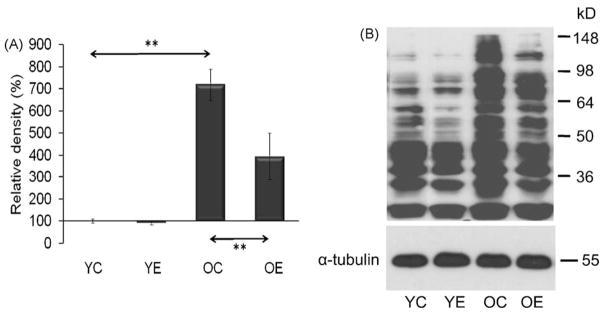
Fig. 6.
Change in levels of carbonylated proteins in response to age and exercise. (A) Graphical illustration of results from densitometry. (B) Representative auto radiogram of carbonylated proteins from muscles of control and exercised animals. Densities of the bands were normalized to tubulin which served as an internal control. In panels (A) and (B): YC, young control; YE, young exercised; OC, old control; OE, old exercised. Values are means ± S.E. for six animals per group; **p < 0.01.

