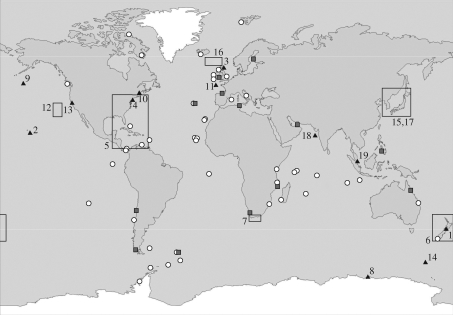
Figure 7.
Reports of plastic fragments in the marine environment presented in chronological order: 1, Harper & Fowler (1987) report on plastic (mainly pre-production pellets) ingested by seabirds since 1960; 2, plastic fragments found in body cavity of dead laysan albatrosses during 1966 survey (Kenyon & Kridler 1969); 3, synthetic fibres in medium plankton net hauls (size not specified) (Buchanan 1971); 4, polystyrene spherules (average 500 µm) in coastal waters (Carpenter et al. 1972); 5, particles, spheres and discs (1–5 mm) in surface waters (Colton et al. 1974); 6, resin pellets (approx. 5 mm) on shoreline (Gregory 1978); 7, temporal trends in abundance and composition of plastic on beaches 1984–1989 (Ryan & Moloney 1990); 8, plastic particles (approx. 3 mm) in gut of storm petrels (van Franeker & Bell 1988); 9, fragments (≥500 µm) at sea surface (Shaw & Day 1994); 10, micro-plastic fibres (≥20 µm) in sewage sludge (Habib et al. 1996); 11, fragments in deep sea (size not specified) (Galgani et al. 2000); 12, fragments (≥350 µm) at sea surface (Moore et al. 2001a); 13, fragments and resin pellets on shoreline (size not specified) (Moore et al. 2001b); 14, fragments (≥1 mm) in scats of fur seals (Eriksson & Burton 2003); 15, fragments (≥1 mm) on beaches (Kusui & Noda 2003); 16, micro-plastics (≥20 µm) in surface waters and on beaches (Thompson et al. 2004); 17, resin pellets (approx. 5 mm) on beaches (Endo et al. 2005); 18, micro-plastics (≥10 µm) on shorelines near ship breaking yards (Reddy et al. 2006); 19, micro-plastics in surface waters and sediments (≥1.6 µm) (Ng & Obbard 2006). Red squares show distribution of micro-plastics (≥ 20 µm) in intertidal sediments (R. C. Thompson et al. 2003–2007 unpublished data). White dots show mega- and macro-plastic strandline surveys (Barnes 2002, 2005).

