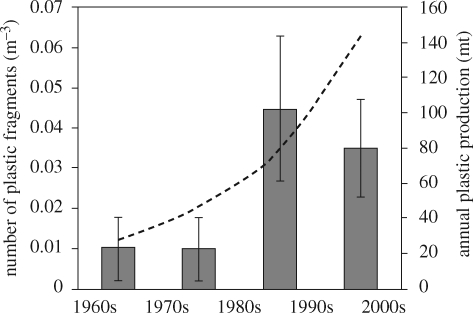
Figure 8.
Microscopic plastic in surface waters, collected with continuous plankton recorder, revealed a significant increase in abundance when samples from the 1960s and 1970s were compared with the 1980s and 1990s (F3,3 = 14.42, p < 0.05). Global production of plastic overlain for comparison (APME 2006). Grey boxes, number of plastic fibres (m−3); dashed line, plastic produced per year (million tonnes). (Reproduced with permission from Thompson et al. 2004.)

