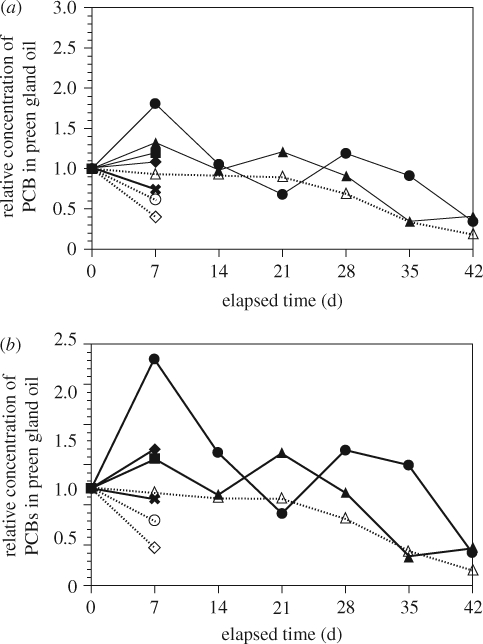
Figure 12.
Time-course of PCBs in preen gland oil of the chicks during the feeding experiment: (a) total PCBs* and (b) lower chlorinated congeners**. *Total PCBs: sum of CB nos 8, 5, 28, 52, 44, 90, 101, 110, 77, 118, 132, 153, 138, 160, 187, 128, 180, 170, 190, and 206; **lower chlorinated congeners: sum of CB nos 8, 5, 18, 28, 52, 44, 66, 95. Polychlorinated biphenyl concentrations are normalized to those on day 0 on each series. Closed symbols and solid lines: plastic-feeding setting; open symbols and dotted lines: control setting. Replicate chicks no. 1 (closed square), 5 (cross), 8 (closed diamond), 10 (closed circle), 14 (closed triangle), 4 (open circle), 9 (open triangle), 18 (open diamond) were analysed. For chicks 1, 5, 8, 4, 18, samples were analysed on day 0 and day 7 only.

