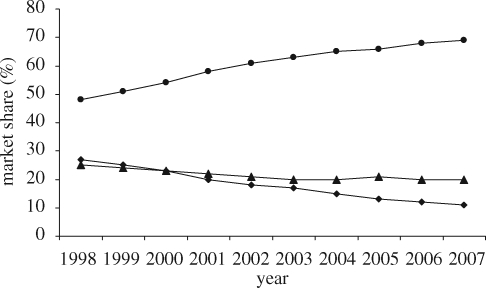
Figure 2.
Market share of various materials used for the packaging of soft drinks 1998–2007 (Canadean 2008). Notes: (i) combined total volume for 32 European countries; (ii) packaged water, carbonates, juice, nectars, still drinks, iced tea and coffee, sports drinks, energy drinks, squash/syrups, fruit powders; (iii) ‘others’ include metal (cans), board (cartons), foil (pouch) and other types of plastics. (Diamonds, % glass share; circles, % PET share; triangles, % others.)

