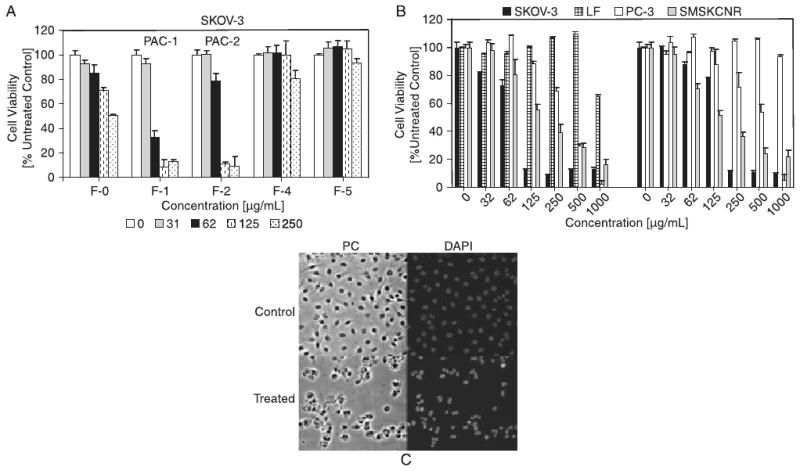
Figure 3.

Comparative cytotoxicities of proanthocyanidins in different human cancer and control cell lines. (A) Polyphenolic fractions isolated from cranberry were screened for their cytotoxic potential against SKOV-3 cells. PAC-1 (F-1) exhibited the highest cytotoxicity. (B) PAC-1 was screened against human SKOV-3 (ovarian cancer), PC-3 (prostate cancer), SMS-KCNR (neuroblastoma) cell lines and LF (lung fibroblasts). Cells were treated with various concentrations (0 to 1000 μg/mL) of PAC-1 and PAC-2 for 48 h. The MTS viability assay was used to measure viability. Experiments were performed in triplicates; data are expressed as the mean of the triplicate determinations (X ± SD) of a representative experiment in % cell viability of samples with untreated cells [100%]. (C) SKOV-3 cells treated with PAC-1 (0-top panel or 200 μg/mL-bottom panel) for 24 h before microscopic analysis by phase contrast (PC) or fluorescence analysis after chromatin staining using a DAPI stain. Cells were photographed with a fluorescence microscope (20× objective).
