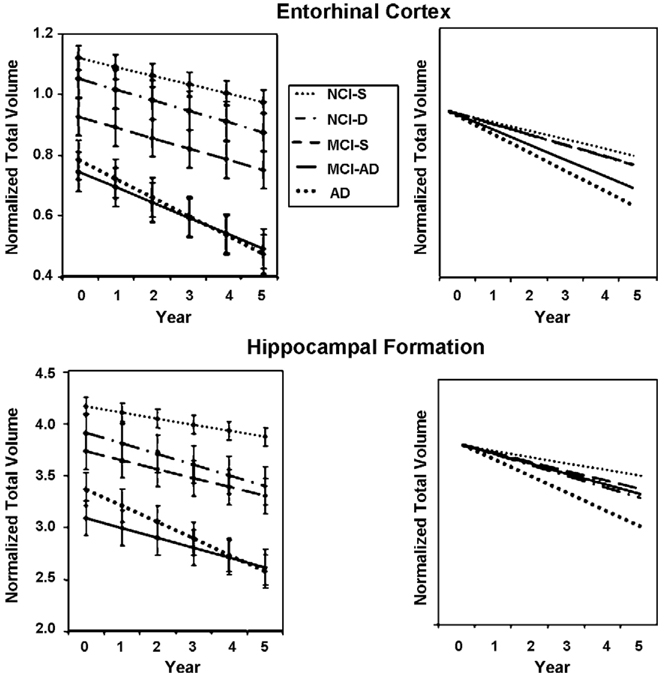
Fig. 3.
Mean normalized entorhinal cortex and hippocampal volumes at baseline and over the 5 years of follow-up for the five groups described in Fig. 2B (left hand panels). The slopes shown are modeled linear slopes. Vertical bars represent the standard error of the mean. In the right hand panels, the same baseline starting point was used for all groups to better appreciate differences in slope.

