Fig. 1.
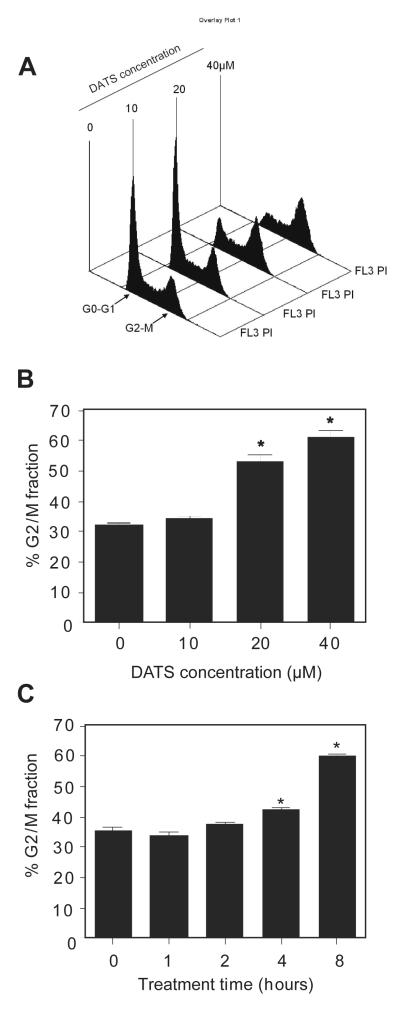
DATS treatment caused G2/M phase cell cycle arrest in DU145 cells in a concentration- and time-dependent manner. A Representative flow histograms depicting cell cycle distribution in DU145 cultures following 8 h treatment with the indicated concentrations of DATS. B Percentage of G2/M fraction in DU145 cultures after 8 h treatment with the indicated concentrations of DATS. C Percentage of G2/M fraction in DU145 cultures after treatment with 40 μM DATS for the indicated time periods. Results shown are mean ± SE (n= 3). *, P<0.05, significantly different compared with control by one-way ANOVA followed by Dunnett’s test.

