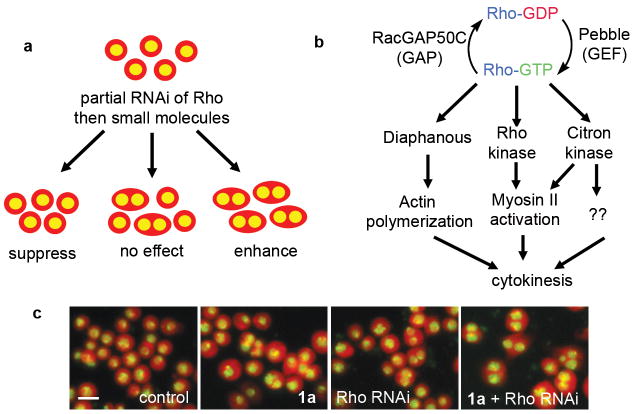
Figure 1.
(a) A small molecule/RNAi modifier screen. (Whole cells are cartooned in red, nuclei in yellow). (b) Simplified diagram of Rho signaling during cytokinesis. (c) Example of synergy between Rho RNAi and a hit compound (Rhodblock 1a). Note how the percentage of binucleate cells is relatively low in cells that are treated with RNAi or compound, but increases with both RNAi and compound treatment (Drosophila Kc167 cells are shown in red, nuclei in yellow). The scale bar shown in the control image represents 10μm.

