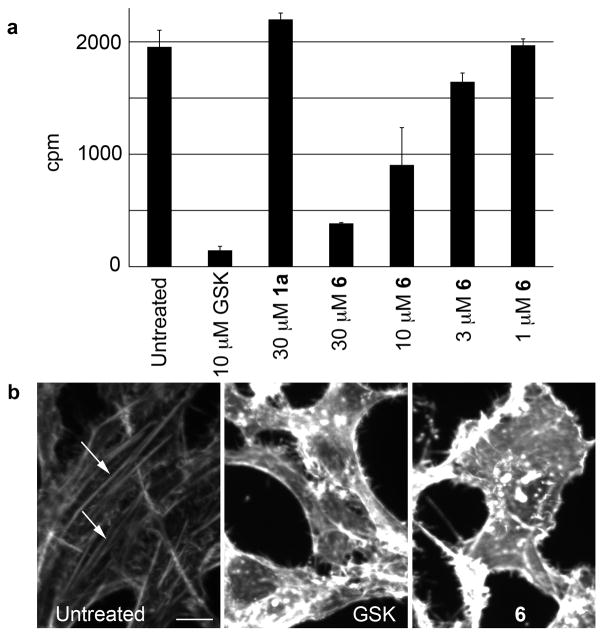
Figure 2.
(a) Drosophila Rho kinase assay data for Rhodblock 6. A dose-response curve is shown as well as control data for the Rho kinase inhibitor GSK269962A and Rhodblock 1a. For a full panel, see Supplementary Figure 6. Error bars indicate standard deviation (n=2). (b) Rhodblock 6 (100μM) and GSK269962A (10 μM) cause disappearance of actin stress fibers in HeLa cells (white arrows in control image. HeLa cells were treated for 20 h and fixed. Actin was visualized using phalloidin staining. The scale bar shown in the control image represents 10μm.

