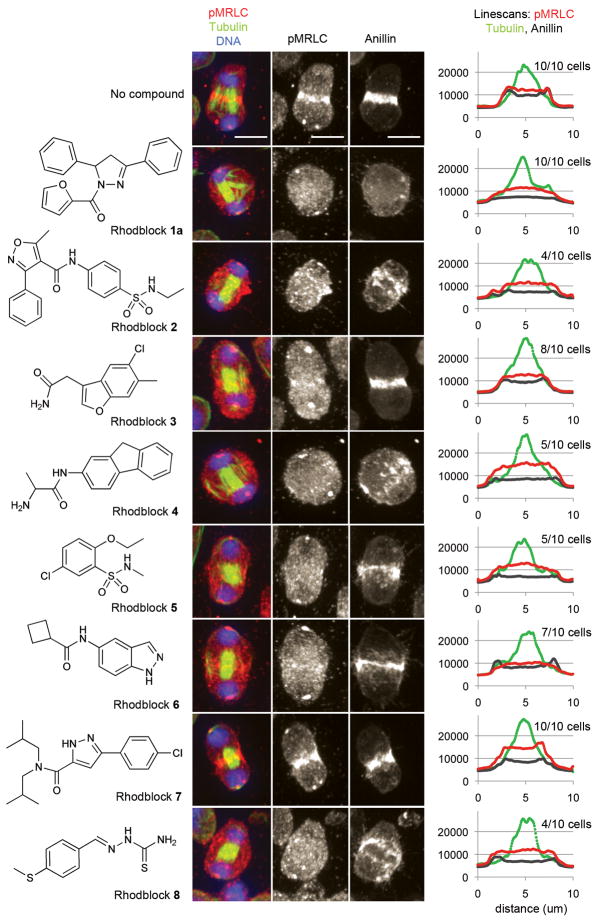
Figure 3. Several Rhodblocks prevent the accumulation of phospho-myosin regulatory light chain and/or Anillin at the cleavage furrow.
The chemical structures of Rhodblocks 1a–8 are shown on the left. Immunofluorescence images of representative phenotypes for each Rhodblock are shown in the middle. Phospho-MRLC (red), tubulin (green) and DNA (blue) have been visualized in Drosophila Kc167 cells. For greater clarity, the middle panel shows gray-scale images of phospho-MRLC staining only. The right panel shows gray-scale images of Anillin staining in the same cell. The images were taken under identical conditions and were processed identically (see Supplementary Methods). The scale bar shown in the control images represents 5μm. We analyzed images of 10 cells for each condition (4 h treatment with compound at the minimally synergistic concentration after overnight Rho RNAi sensitization). For each cell we analyzed, we placed a line across the cleavage furrow and quantitated the fluorescence intensities for phospho-MRLC, Anillin and tubulin staining (see Supplementary Methods). We then averaged the line scans for cells exhibiting the phospho-MRLC phenotype shown in this figure (shown on the right). The number of cells represented by the image is shown in parentheses above the linescans for each compound. In the linescans, the x axis represents fluorescence intensity (AU). Bumps in fluorescence intensities at the edge of the cell are characteristic of an intact furrow (e.g. control cell), uniform fluorescence intensities across the entire cell are characteristic of a missing furrow (e.g. Rhodblock 1a). In Rhodblock 6-treated cells, Anillin forms a furrow while phospho-MRLC does not.

