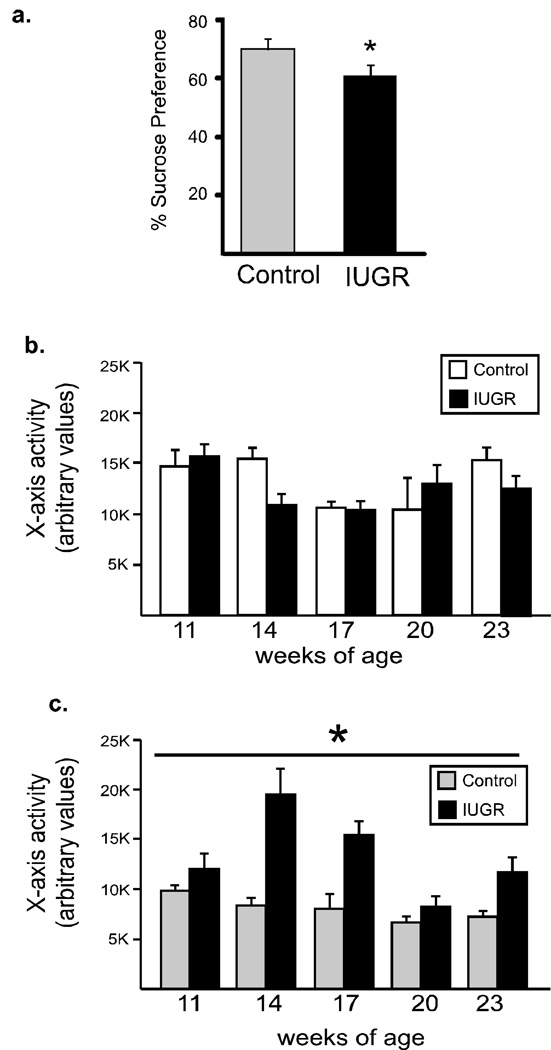
Figure 5. Sucrose intake and locomotor activity.
Sucrose preference (a) was evaluated in IUGR (gray bars) and control (black bars) mice (n=4–5/group). IUGR mice show reduced preference for sucrose. *p <0.05 Locomotor activity was evaluated every 3 weeks in the CLAMS cages for 12 hr, beginning at the onset of lights off. Animals fed the control diet (b) did not differ in activity levels, however, when animals were fed a high-fat diet (c) IUGR animals demonstrated significant hyperactivity (main effect for group, *p<0.003). n=4/group.

