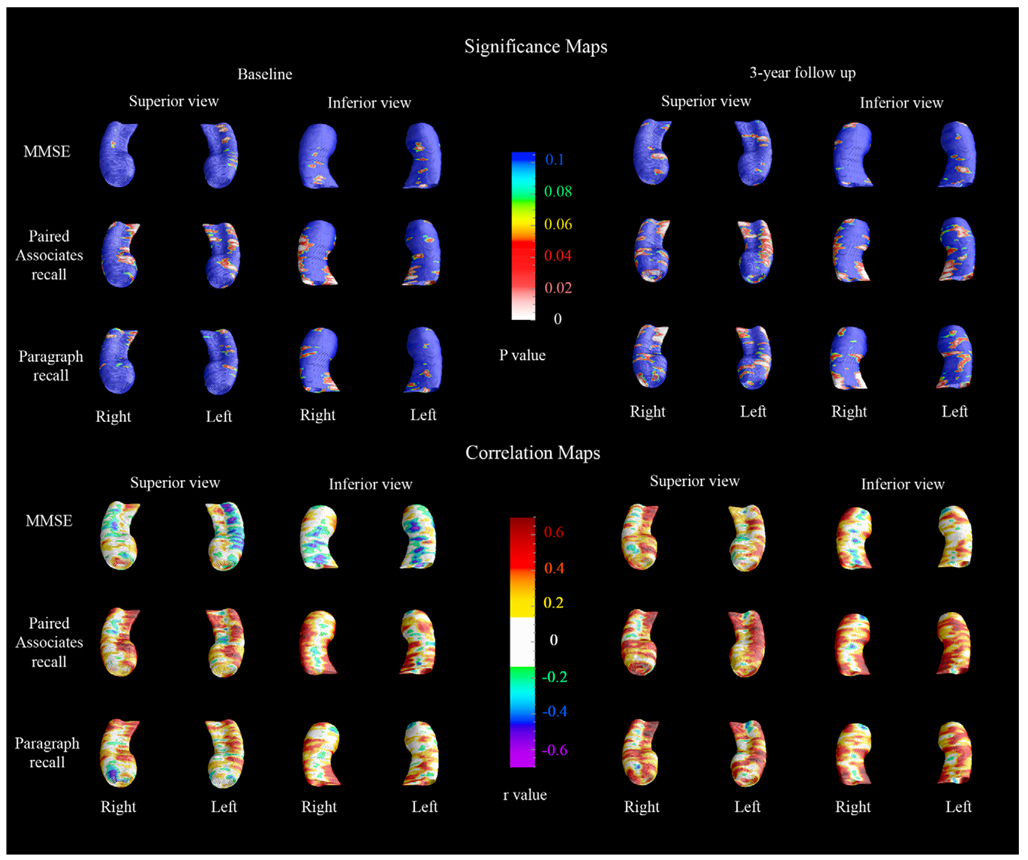
Fig. 6.
3-D cognitive correlations maps. The significance maps (top) show the regions where significant negative correlations between the given cognitive measure and hippocampal atrophy was observed. The correlation maps (bottom) show the regional strength of the cognitive correlation. In the significance maps, dark blue colors denote p-values of 0.1 or higher.

