Figure 4.
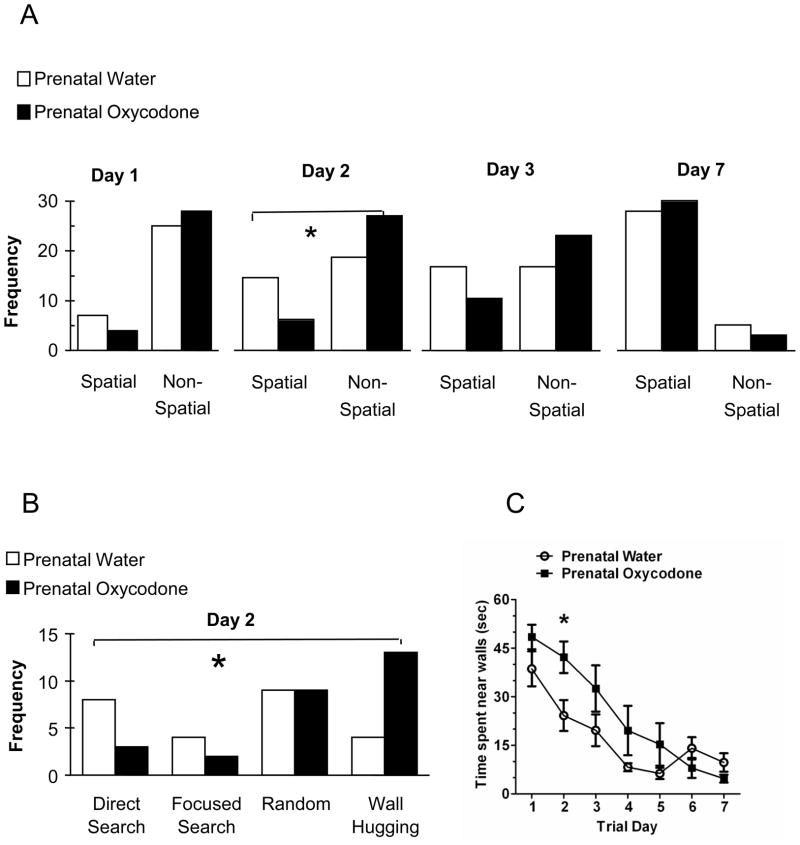
Panel A depicts the frequency of trials where a spatial or a non-spatial search strategy was used on days 1, 2, 3, and 7 (last day) of the long intertrial interval version (40–60 min) of the Morris water maze. On test day 1, there no difference in the type of search strategies used as a consequence of prenatal drug exposure. However on test day 2, prenatal oxycodone-exposed rats had fewer trials where they used a spatial search strategy as compared to prenatal water-exposed rats. By test day 3, the search strategy profiles were no longer different between prenatal treatment groups and this continued for the remainder of testing (day 7 is depicted for comparison). Panel B depicts the breakdown of the top two spatial (direct search and focused search) and non-spatial (random and wall hugging) strategies on day 2 of testing. Prenatal oxycodone-exposed rats had fewer trials where they used a spatial search strategy as compared to prenatal water-exposed rats. This was particularly evident for the direct search spatial search strategy (decreased) and the non-spatial wall hugging strategy (increased). Panel C depicts the wall hugging strategy represented as the amount of time spent in within the outer 25% of the maze circumference. Prenatal oxycodone-exposed rats spent more time near the walls of the maze as compared to prenatal water-exposed rats. Open bars and symbols depict Prenatal Water and dark bars and symbols depict Prenatal Oxycodone. N=8 for both groups. (*p < 0.05).

