
Fig. 6.
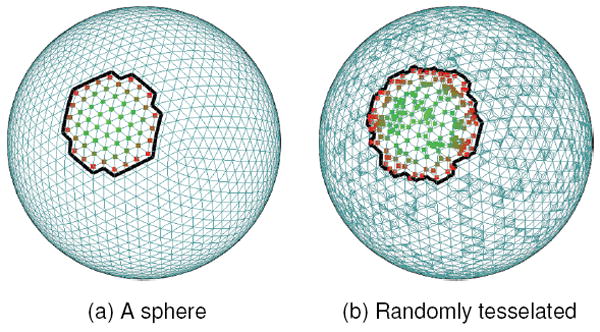
This figure illustrates one of our test cases for tessellation sensitivity. (a) Shows a sphere, with 5,120 faces. (b) Shows the same sphere after 5,000 rounds of subdivision, with replacement. Also shown is a sample neighborhood on each sphere. Note the uneven distribution of sample points arising from subdivision.