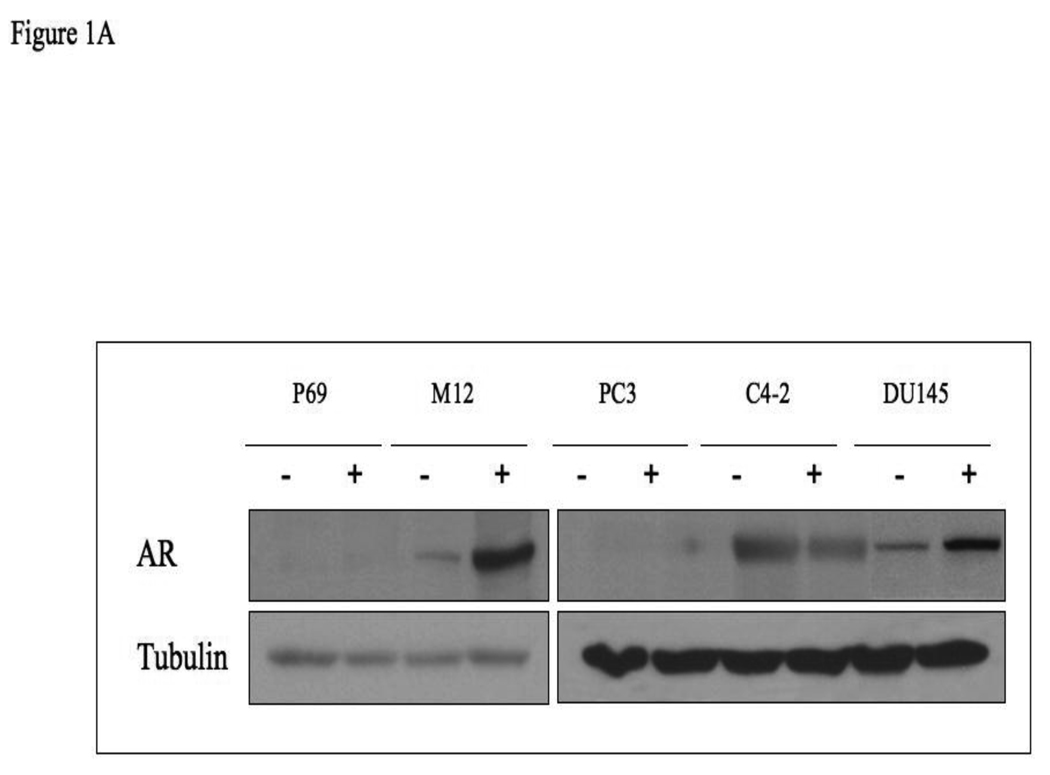
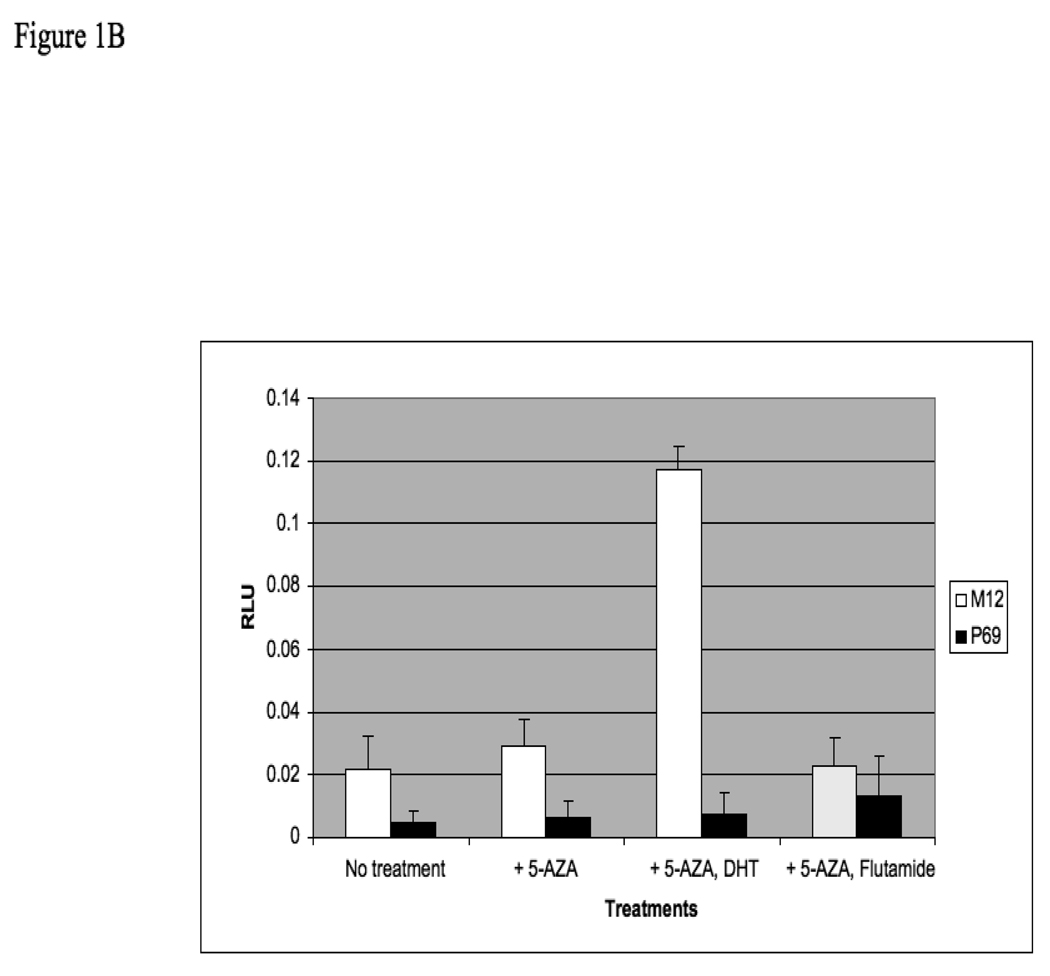
Figure 1. AR expression analysis in prostate cancer cells after 5-Aza treatment.
(A) P69, M12, PC3, C4-2 and DU145 cells were treated with 5-Aza (1 µg/ml) for 72 hr (+), or left untreated (−), after which cells were lysed and AR levels were measured by Western blots. After stripping, the blot was reprobed with a tubulin antibody for control purposes. (B) P69 and M12 cells were treated with 5-Aza or vehicle for 72 h. Cells were then transiently transfected with an AR luciferase reporter construct (AAR3) including a tandem probasin promoter sequence using lipofectin. After 24 h, DHT (10−9 M) was added in the absence or presence of flutamide. After 5 h, cells were harvested and luciferase assays were performed. RLU, relative luciferase units. Results are controlled for transfection efficiency with β-galactosidase cotransfection. The experiment was performed in triplicates and the error bars represent ± 2 SD.


