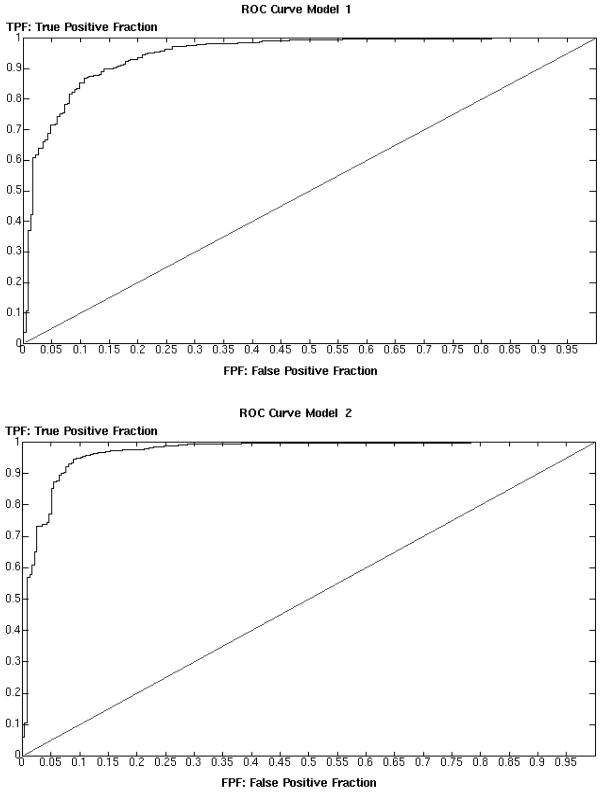
Figure 4.
ROC curves relative to the analysis of an external dataset of compounds with reported CNS activity of lack thereof. The area under the curve is 0.95 and 0.97 respectively, indicating a very high predictive power for both models. A perfect model would have an area of 1, while a random model, denoted by the diagonal line, would have an area of 0.5.

