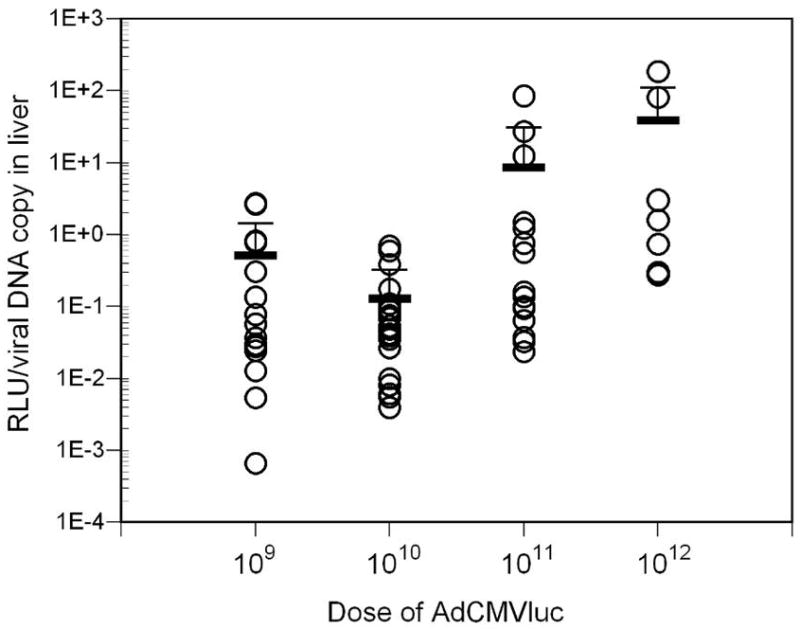
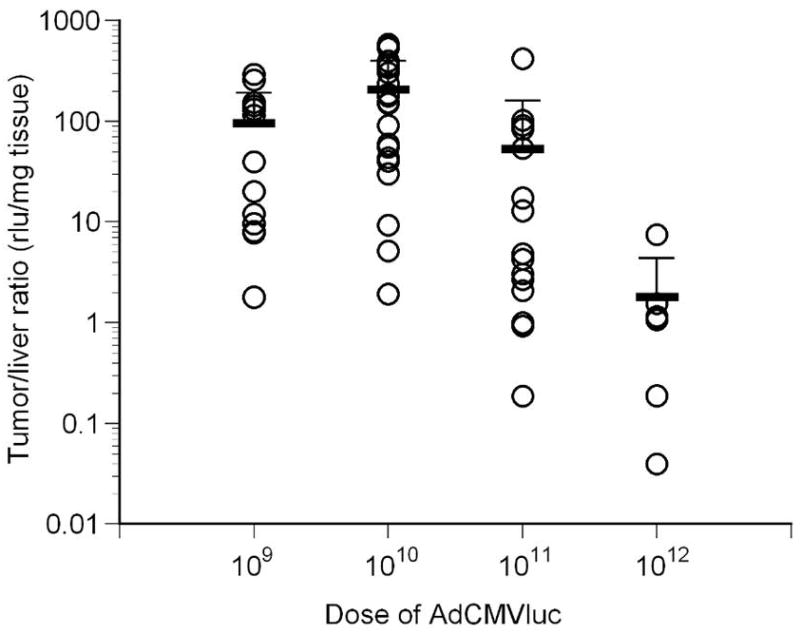
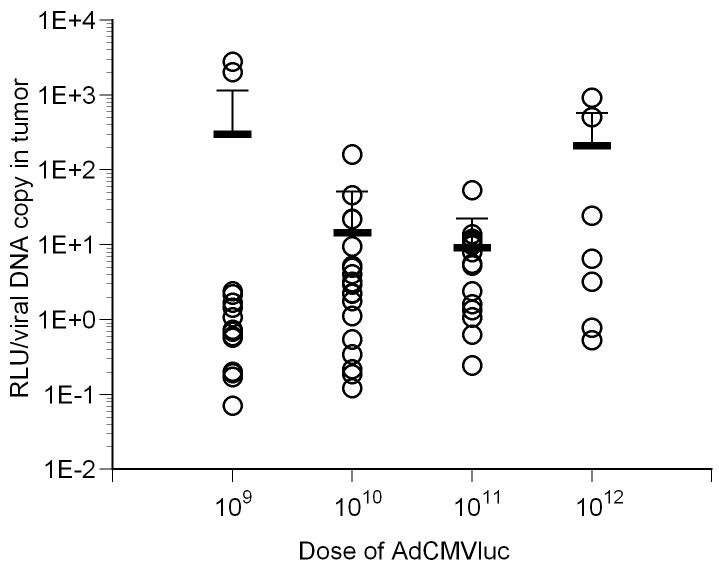
Figure 2.


Luciferase activity and viral DNA content in tumors following intravenous injection with varying doses of AdCMVLuc. Mean and standard deviation are given by the horizontal and error bars. Panel A, specific activity in RLU/DNA copy in tumors of individual mice. No significant differences among the four doses were observed. Panel B, the specific activity in RLU/DNA copy in livers of individual mice is shown. All groups were significantly different from each other (p=0.001 by Kruskal-Wallis, Mann-Whitney p<0.002). Panel C, specificity of luciferase expression in mice, calculated from tumor/liver ratio. The ratios for all groups were significantly different from each other (p<0.001 by Kruskal-Wallis, Mann-Whitney p<0.03) except for 109 vs. 1011.

