
Figure 3.
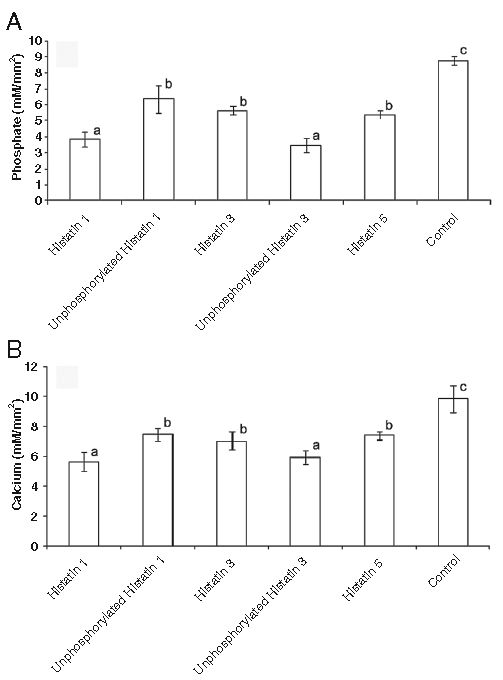
Phosphate (A) and calcium (B) released from human enamel sections first exposed to specific histatin preparations or control buffer followed by exposure to demineralizing solution. Ordinates: Ion composition of demineralizing solution after 12 days’ exposure. Abscissae: Columns indicating protein preparations and controls used in enamel window treatment for 2 hrs (n = 5 per group). Different superscripts indicate statistical difference, and the same superscripts indicate no statistical difference, according to Tukey’s test among proteins and control. Bars represent standard deviation of the mean.