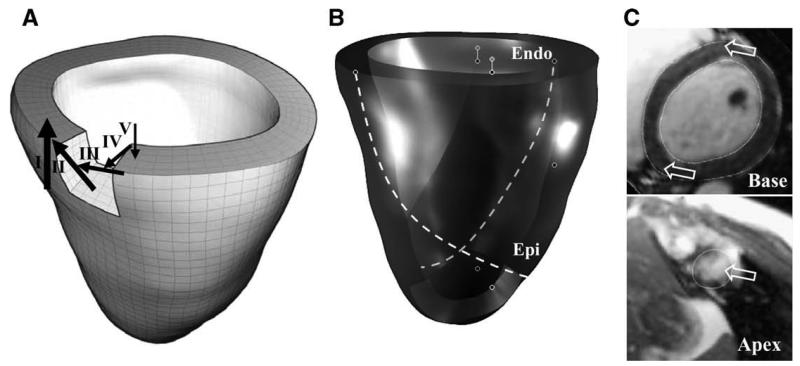
Fig. 3.
Illustration of local fiber directions used for constitutive model. (A) Simplified representation with fiber direction varying from −90° at the epicardial surface to +90° at the endocardial surface for the basal level. (B) Helical fiber directions added for epicardial and endocardial layers. (C) Fiber directions at the basal septum (top panel) and apex (bottom panel) were modified to align with estimates from diffusion tensor- (DT-) MRI data from a human cadaver heart. Arrows in this panel show the orientation of the fiber directions at these locations.

