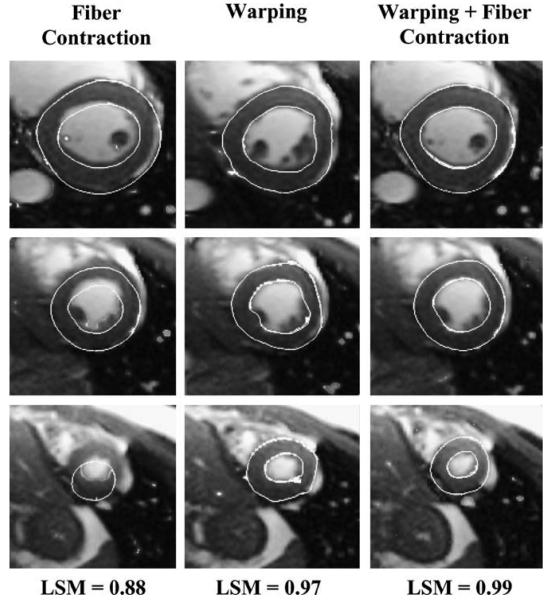
Fig. 8.
Graphical depiction of image registration and corresponding values for the landmark similarity measure (LSM). Left – registration obtained using only systolic fiber contraction forces (no warping); note the poor registration in all three crosssections, LSM = 0.88. Middle – registration obtained using only warping solution, LSM = 0.97. Right – best fit, systolic fiber contraction forces with warping, LSM = 0.99.

