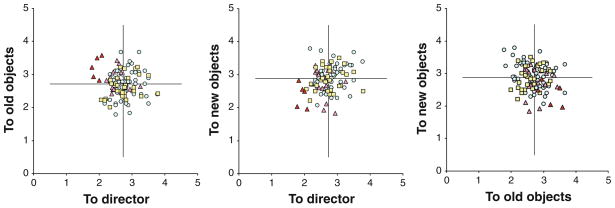
Fig. 1.
Scatterplots for interest to old (familiar) objects by director, interest to new (unfamiliar) objects by director, and interest to new objects by old objects. Vertical and horizontal lines represent means. Triangles represent children with autism (n = 23), squares represent children with Down syndrome (n = 29), and circles represent typically developing children (n = 56). The five darker triangles represent the 5 children with autism who remained low in interest to the director over intermissions; see text

