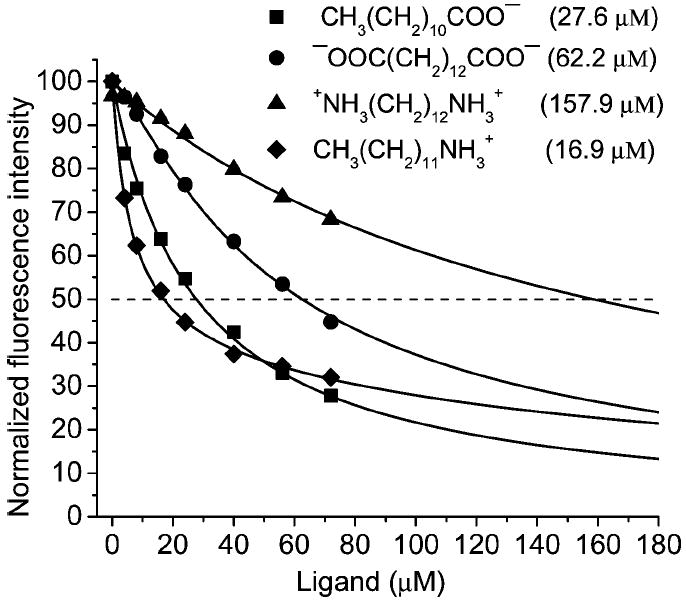
Figure 13.

Displacement of DAUDA from the DAUDA(2 μM)–TL(4 μM) complex by various ligands at pH 7.3. Excitation and emission wavelengths were 345 and 498 nm, respectively. IC50 values for each ligand are shown in parentheses. Solid curves are generated by fitting of the experimental data to one binding site model.
