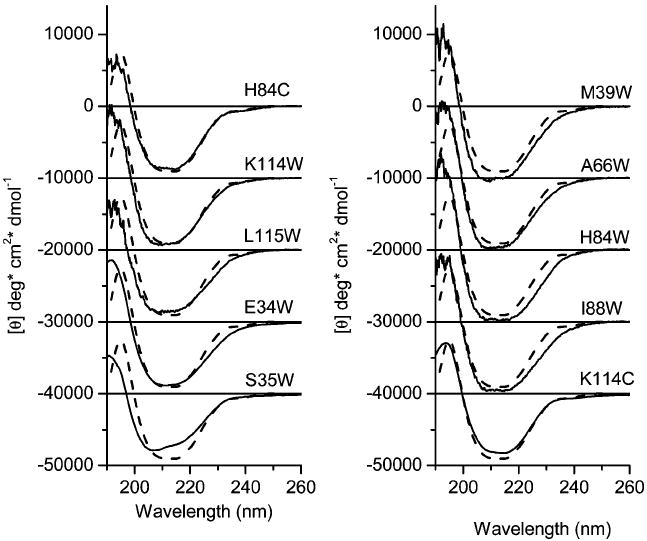
Figure 2.

Far-UV CD spectra of TL mutants. CD spectra were recorded using protein concentrations of 1.2 mg/mL in 10 mM sodium phosphate at pH 7.3. To reduce overlap, the spectra were shifted vertically. For comparison, the spectrum of wild-type TL (dashed line) was added to each spectrum of the mutant protein.
