Figure 4.

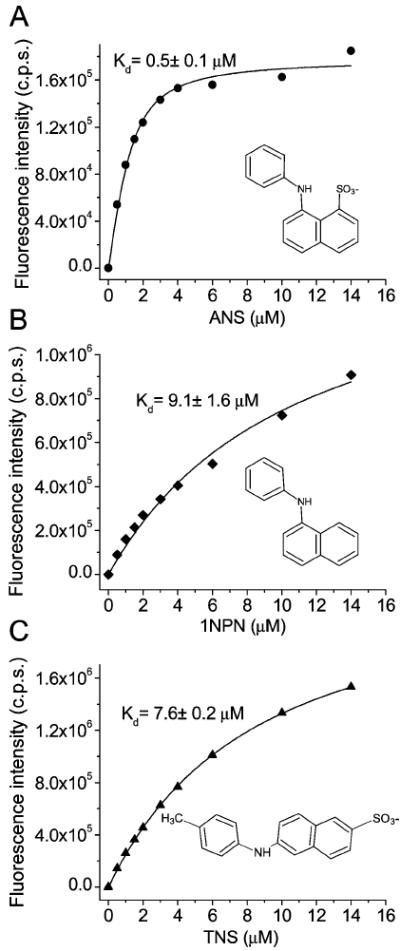
Binding curves of the fluorescence probes ANS (A), 1NPN (B), and TNS (C) to apoTL (5 μM). Emission λ values for ANS, 1NPN, and TNS binding were 465, 416, and 432 nm, respectively.

Binding curves of the fluorescence probes ANS (A), 1NPN (B), and TNS (C) to apoTL (5 μM). Emission λ values for ANS, 1NPN, and TNS binding were 465, 416, and 432 nm, respectively.