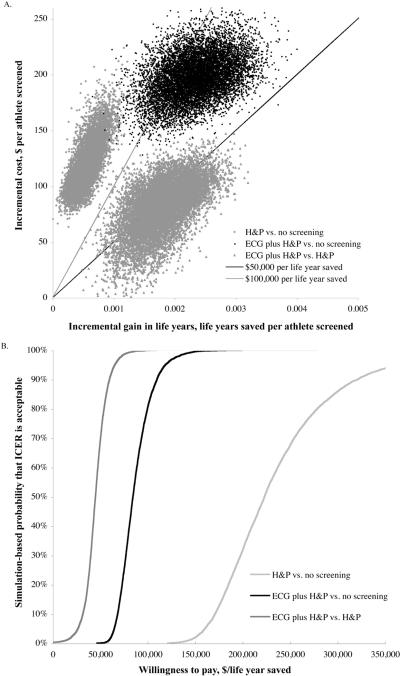
Figure 3.
Probabilistic Sensitivity Analysis. (A) Scatter plot of simulation performed for each of three base case comparisons, varying each input variable over the expected range of the population median. Note that in nearly all simulations, history and physical is weakly dominated by ECG plus history and physical, as it is less costly, less effective, and has a higher incremental cost-effectiveness ratio. Incremental cost effectiveness ratios can be determined by dividing the discounted life years saved by the incremental discounted cost. Reference lines for incremental cost effectiveness ratios of $50,000 per life year saved and $100,000 per life year saved are shown. Dots below each of these lines represent simulations with incremental cost-effectiveness ratios falling below these willingness to pay thresholds. (B) Willingness to pay curves for comparisons between ECG plus history and physical and history and physical (dark gray); between ECG plus history and physical and no screening (black), and between history and physical and no screening (gray). Proportion of simulations plotted versus incremental cost-effectiveness ratio for each of three base case comparisons. Simulations that were not life saving are included in the proportion of simulations above $300,000 per life year saved. The probability of preferring ECG plus H&P compared to H&P alone is 68% at a willingness to pay threshold of $50,000 per life year saved and 99.9% at $100,000 per life year. ECG plus H&P is cost- and life-saving in 0.2% of simulations vs. H&P alone. The probability of preferring ECG plus H&P compared to no screening is 0% at a willingness to pay threshold of $50,000 per life year and 79.9% at $100,000 per life year. The probability of preferring H&P compared to no screening is 0% at $100,000 per life year.

