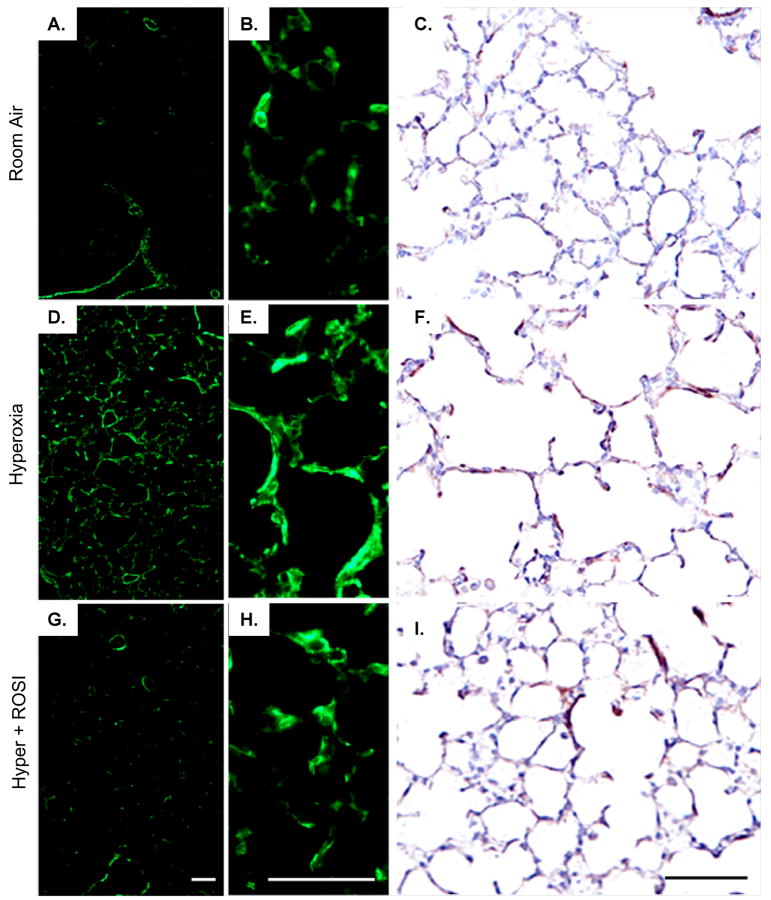
Figure 6. Myofibroblasts Increased with Hyperoxic Exposure in the Neonatal Lung on P13.
α-SMA expression was localized by immunostaining following RA, HE and HE+ROSI. On P13 α-SMA protein expression was increased in the hyperoxic exposed and HE+ROSI groups relative to the RA group. Representative immunostained images of A-C. RA, D-F. HE, G-I. HE+ROSI. Positive α-SMA localization with immunofluorescent detection appeared green or DAB detection (CFI), brown. B,E,H. Respective enlargements of alveolar structures (from ADG). Scale bar=50uM.

