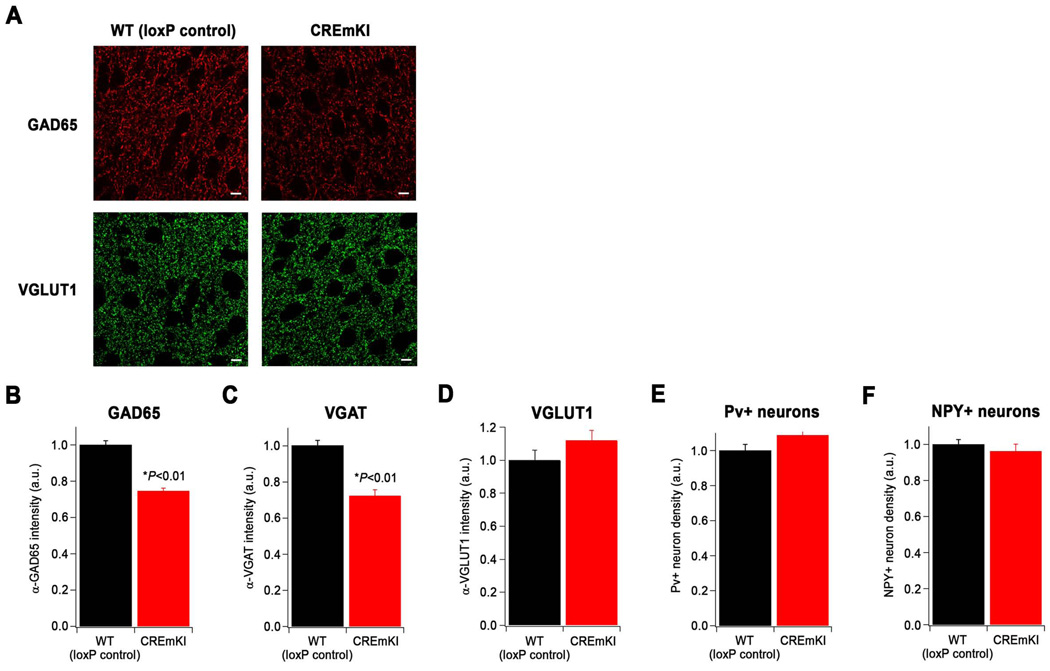
Figure 7.
Reduced immunoreactivity for inhibitory synaptic markers in CREmKI cortex. A) Representative images of immunostaining with antibodies recognizing GAD65 (red), which is enriched in inhibitory presynaptic terminals, and VGLUT1 (green), which is enriched at excitatory presynaptic terminals, in layer II/III of CREmKI and loxP control primary visual cortex. Scale bar, 5µm. B–D) Quantification of the average intensity of α-GAD65 (B, 74–77 fields/genotype), α-VGAT (C, 48 fields/genotype), and α-VGLUT1 (D, 48 fields/genotype) immunostaining in CREmKI and loxP control littermates. Asterisk indicates P<0.01, two-way ANOVA with pairwise comparison by Bonferroni-Dunn post-hoc test. Data are mean ± SEM from 3–4 pairs of littermates. E–F) Quantification of the number of paralbumin- (E) and NPY- (F) positive inhibitory neurons in the primary visual cortex of CREmKI and loxP control littermates, normalized to the number of total nuclei. P>0.05 for either parvalbumin-positive or NPY-positive neurons, two-way ANOVA. Data are mean ± SEM collected from n=24 hemispheres from 3 pairs of littermates.

