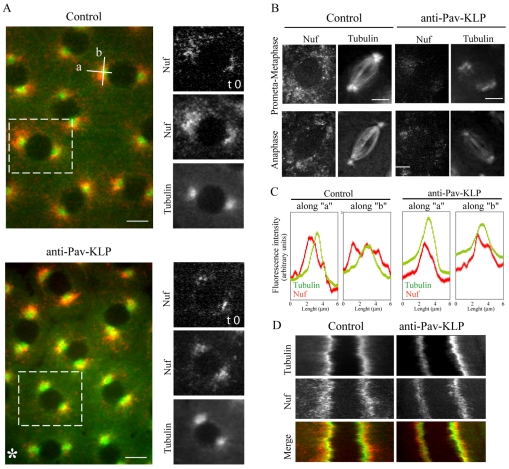
Fig. 5.
Effect of Pav-KLP inhibition on Nuf distribution. GFP-Nuf-expressing embryos were injected with anti-Pav-KLP antibody and Rhodamine-tubulin. To obtain a better view of Nuf distribution over time, consecutive images are projected onto a single one. (A) Nuf distribution (red) around the centrosomes (tubulin, green) during prophase in a projection of images recorded every 2 seconds for a total of 50 seconds. The distribution of Nuf at t=0 is shown on the right for a single spindle (boxed area). After Pav-KLP inhibition, the amount of Nuf around the centrosomes is reduced (compare frames at t=0) and Nuf stays closer to the centrosome (compare projections over time). Asterisk marks the site of antibody injection, where defects are more severe. Scale bars: 5 μm. (B) Nuf distribution for different stages of mitosis. Each image is a time projection of 30 (prometaphase-metaphase) and 15 (anaphase) images taken every 0.5 seconds. The projection for Rhodamine-tubulin is used as a reference for spindle movement. Pav-KLP inhibition reduces the amount of Nuf and changes its localization. Scale bars: 5 μm. (C) Linescans showing tubulin and Nuf distribution in control and anti-Pav-KLP antibody injected embryos along lines ‘a’ and ‘b’ oriented as shown in A. The extension of Nuf around the centrosome is reduced after Pav-KLP inhibition, from 2.85±0.44 μm along ‘a’ and 6.7±0.87 μm along ‘b’ in control to 1±0.28 μm along ‘a’ and 2.9±0.7 μm along ‘b’ in inhibited embryos. (D) Kymograph of Nuf and tubulin during inter-prophase, showing that Nuf (red in merge) is less mobile and stays closer to the centrosome (green in merge) when Pav-KLP is inhibited.

