
Fig. 7.
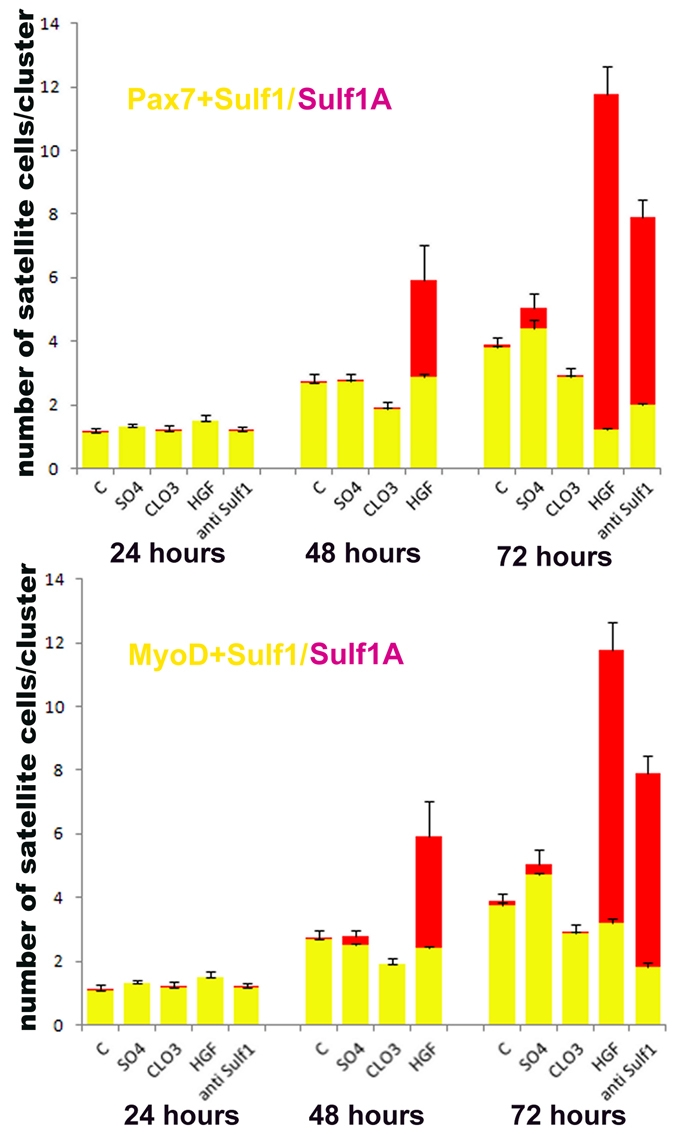
The quantification of satellite cells per cluster and pattern of MyoD, Pax7 or Sulf1A expression under different culture conditions. The quantification of satellite cells per cluster under normal culture conditions (C) and when 8 mM sodium sulfate (SO4) or 8 mM sodium chlorate (CLO3) or 100 ng/ml HGF or 100 ng/ml Sulf1A antibodies were added to the culture medium for 24, 48 or 72 hours. The total height of each bar represents the number of satellite cells per cluster, whereas the height of the yellow bar represents the number of satellite cells per cluster staining for Sulf1A+Pax7 (top panel) or Sulf1A+MyoD (bottom panel). Red bars indicate the cells stained for Sulf1A but not Pax7 or MyoD. The addition of both HGF and anti-Sulf1A antibody induced a significant increase in the size of the satellite-cell cluster at 72 hours when compared with control, HGF (P<0.001), anti-Sulf1A (P<0.03), control (P<0.001). Subtle changes at 24 hour were not statistically significant, but with HGF inclusion producing a significant change at 48 hours (P<0.002). The downregulation of Pax7 and MyoD in a large proportion of the Sulf1A+ satellite cells at 72 hours was also statistically significant, Pax7 (P<0.002), MyoD (P<0.01) as it was also at 48 hours Pax7 (P<0.03), MyoD (P<0.02).