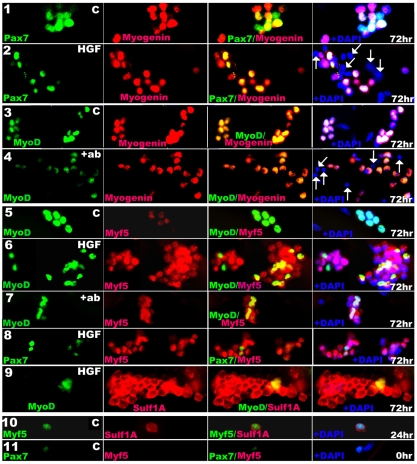
Fig. 8.
Further characterisation of control and Pax7− and or MyoD− cells in HGF and Sulf1A-antibody-treated cultures. A proportion of satellite cells on single fibres that cultured in the presence of HGF (rows 2, 6, 8 and 9) or Sulf1A antibody (rows 4 and 7) following 72 hours in culture, downregulated MyoD and Pax7 without activating myogenin expression but did express Sulf1A and Myf5. Myf5 was undetectable in quiescent satellite cells (row 11) but was activated by in vitro culture (row 10). The expression of Pax7, MyoD, Myf5, myogenin (column 1) and Sulf1A (column 2) is shown individually as well as superimposed images (column 3) and with DAPI (column 4), under different culture conditions. The satellite cells that had downregulated both Pax7 and myogenin in the presence of HGF (row 2) or MyoD and myogenin in the presence of Sulf1A antibody (row 4) are only apparent by blue DAPI staining of their nuclei (white arrows). Myf5 expression in such cultures was usually detectable not only in MyoD− and Pax7− cells but also in a sub-population still expressing these transcription factors. C, control; HGF, hepatocyte growth factor at 100 ng/ml; +ab, + 100 ng/ml Sulf1A antibody; hr, hours.

