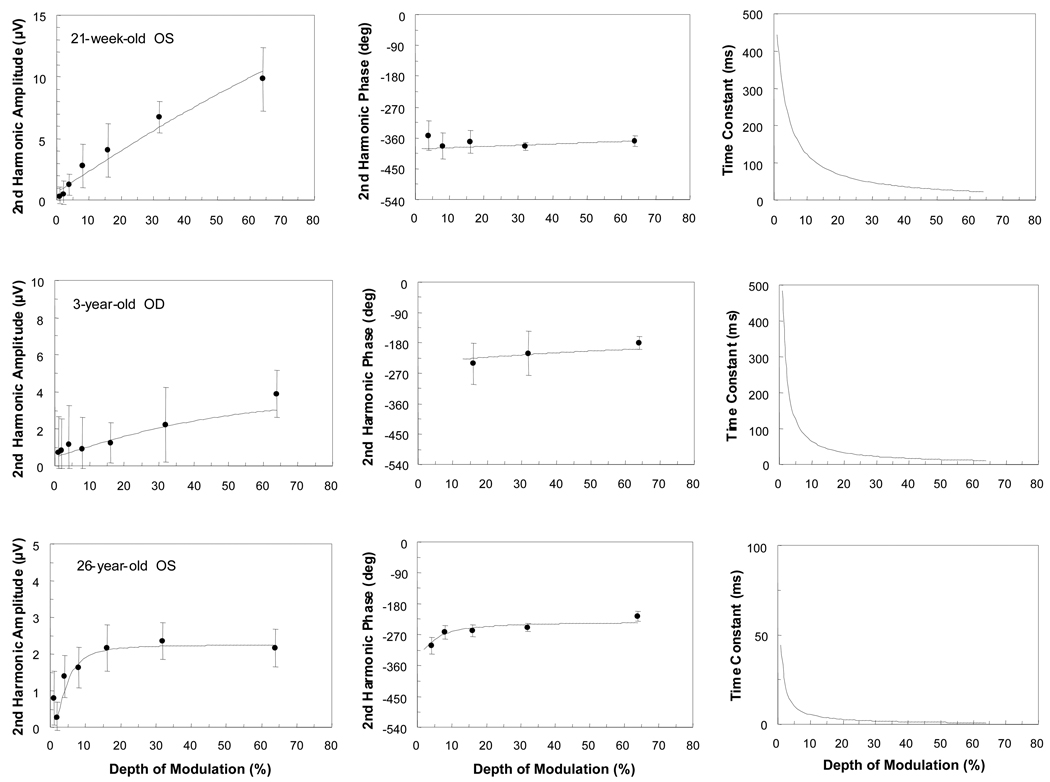
Figure 3.
Amplitude and phase of second harmonic responses and corresponding time constants as a function of contrast (depth of modulation) for the 1.5 c/deg condition. The lines represent the best model fits obtained using the amplitude and phase of the response jointly. Data from a 21-week-old, a 3-year-old and a 26-year-old are shown. Each participant’s age and eye tested are indicated. Note the different amplitude and time constant scales for the different observers. Error bars represent 95% confidence limits.

