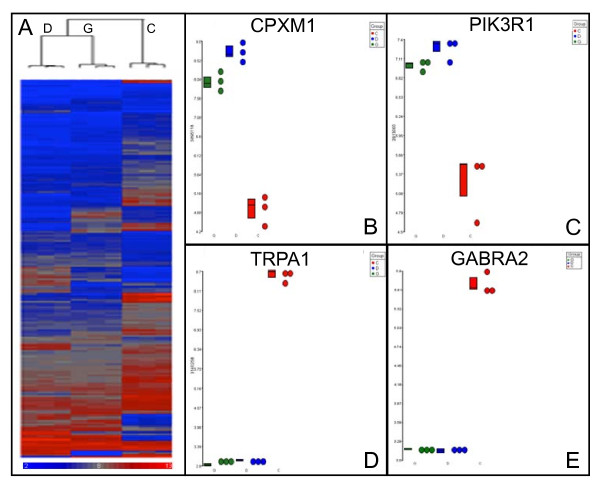
Figure 2.
Global gene expression profile of trisomic BG01V APCs is similar to CCF-STTG1 astrocytoma cells. A. Heat map of unsupervised hierarchical cluster analysis of exon microarray hybridization data derived from the three diploid H9 APC samples (C), the three trisomic BG01V APC samples (G) and the three CCF-STTG1 astrocytoma cell samples (D). Relative over expression is indicated by red and under expression by blue in the heat map. Microarray data was filtered using a p value < 0.001. Individual gene dot plots showing changes in mean expression levels of transcripts CPXM1 (panel B), PIK3R1 (panel C), TRPA1 (panel D) and GABRA2 (panel E). Each panel shows the individual hybridization data for all nine samples, including the three biological replicates of diploid H9 APCs (red), the three independent replicates of trisomic BG01V APCs (green) and the three CCF-STTG1 astrocytoma cell samples (blue).

