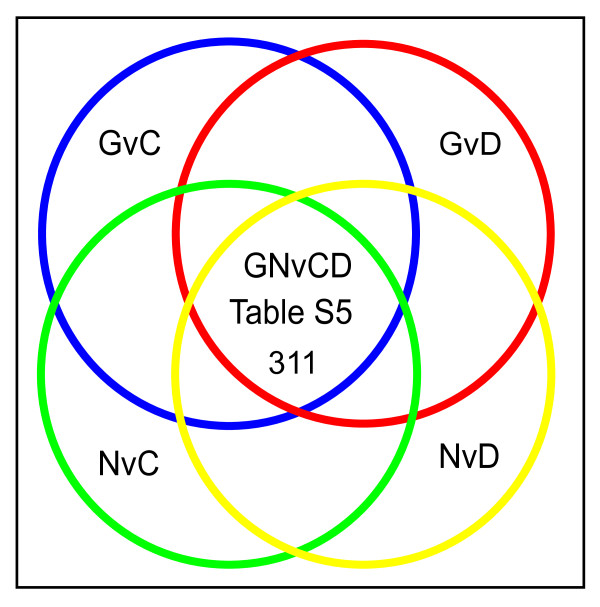
Figure 7.
Intersection of microarray data identifies markers of premalignant astrocytic stem-like/progenitor cells. Venn diagram depicting the overlap between the four pair wise comparisons: GvC, GvD, NvC and NvD that was used to identify the 311 transcripts exhibiting similar changes in expression patterns in trisomic BG01V APCs (samples G) and glioblastoma patients (samples N) relative to diploid H9 APCs (samples C) and CCF-STTG1 astrocytoma cells (samples D), which constitutes the GNvCD gene list shown in Additional file 6, Table S5.

