Figure 6.
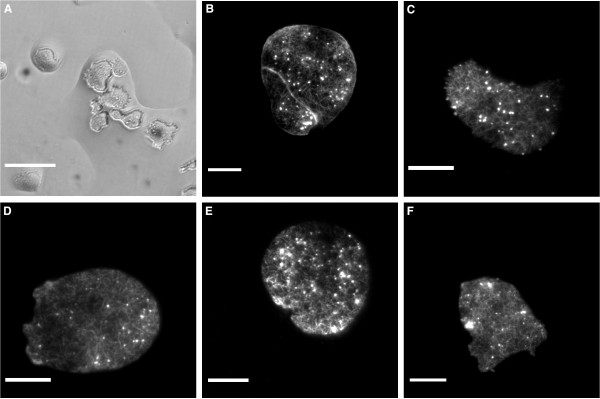
Sample Images using D. discoideum LimE-GFP. (A) BF image of cells under an oil overlayer. The breakup of the wetting layer can be seen, with flatten cells confined inside small aqueous islands. (B-F) TIRF microscopy images of cells flattened by the agar overlay (B), the oil overlay (C), the single layer microfluidic device (D), the closed-end actuator (E) and the through-flow actuator (F). Scale bar in A is 50 μm and the scale bars in B to E display 10 μm.

