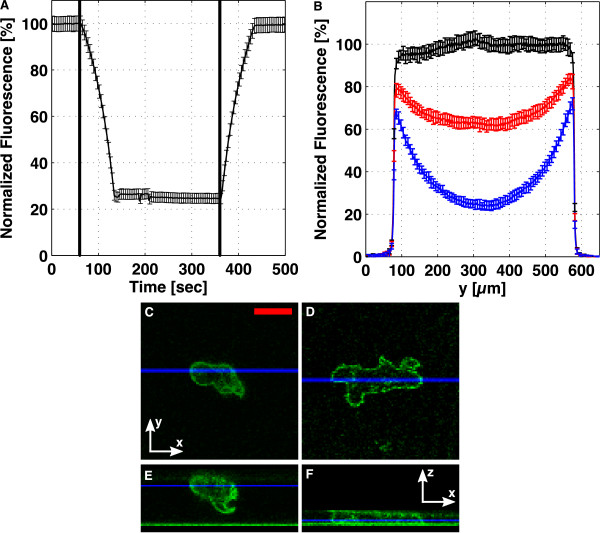
Figure 8.
Characterization of the closed-end actuator. The lower channel was filled with 100 μM fluorescein, and in (A), the fluorescence in the middle of the channel is displayed, as the pressure in the actuation channel is increased, t = 60 s to t = 130 s, and then, as the pressure is released, t = 360 s to 430 s. (B) shows the profile across the channel for different degrees of flattening, with the black, red and blue curves corresponding to t = 20 s, 110 s, and 300 s in (A). Confocal x-y scans are shown for a cAR1-GFP cell (C) before and (D) during flattening. (E, F) show the corresponding x-z sections. The blue lines in (C, D) show the y-values for the sections (E, F), and the blue lines in (E, F) show the z-value of images (C, D). Scale bar: 10 μm.

