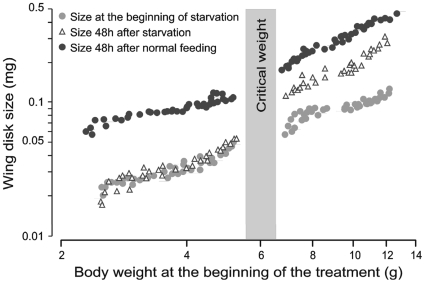
Figure 2. Effect of starvation before and after critical weight on wing imaginal disk growth.
The grey bar represents the mass interval at which 95% of larvae attain the critical weight. Before the critical weight starvation (open triangles) stopped growth. After the critical weight starvation did not stop growth but reduced the growth rate to approximately 66% of control (black circles).

