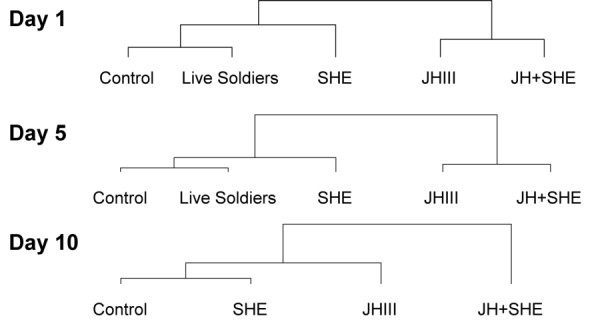
Figure 5.

Hierarchical clustering results of gene expression pattern clustered by treatment. All three days (A-Day 1, B-Day 5, and C-Day 10) were analyzed separately using the relative expression of each gene by the Euclidean distance metric, with centroid squared linkage.
