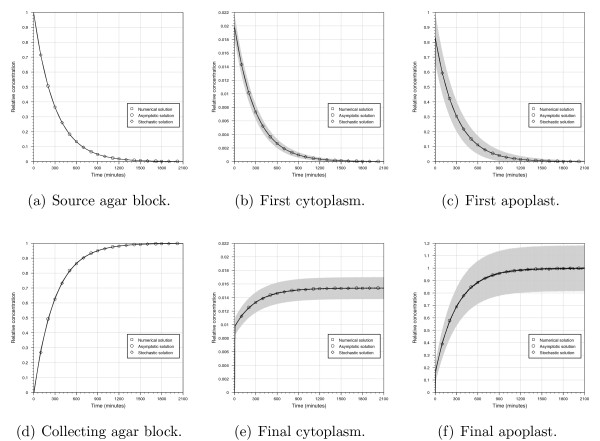
Figure 2.
Predicted auxin concentrations from the deterministic numerical, deterministic asymptotic and stochastic model solutions. Concentrations are given relative to the initial source concentration C/(Lsw). For the stochastic solutions, the mean concentrations are calculated over 10,000 runs, and 95% confidence intervals are given as grey ranges.

