Figure 1.
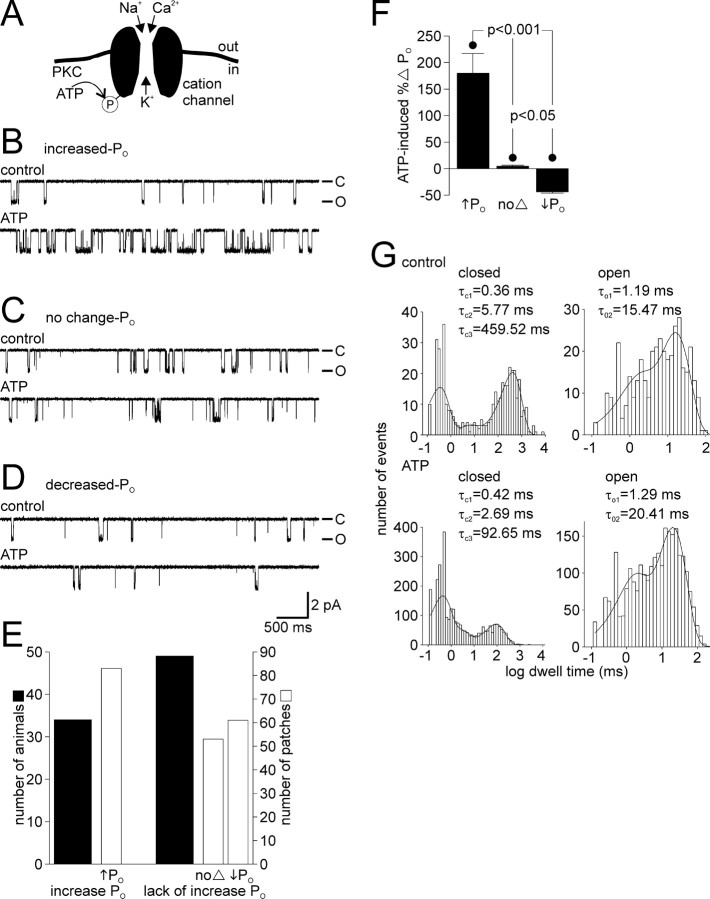
The cation channel can respond to ATP in three distinct ways. A, Schematic diagram of the bag cell neuron cation channel showing its permeability and basis for regulation (based on Wilson et al., 1996, 1998; Magoski et al., 2002). With physiological solutions on both sides of a patch, Na+, K+, and Ca2+ pass through the channel. A closely associated PKC can use ATP as a phosphate source to phosphorylate either the channel or a nearby protein and increase activity. B, Top trace, In an excised inside-out patch, at a holding potential of –60 mV, the activity of the cation channel is seen as unitary inward current deflections of ∼2 pA. The closed state is at the top of the trace and designated by –C, whereas the open state is at the bottom and designated by –O. Bottom trace, Bath application of 1 mm ATP to the cytoplasmic face of the patch produces a rapid and sustained increase in activity (in this particular example, the PO went from 0.039 to 0.337). The PO was calculated over the entire time of the control and ATP periods (usually 1–3 min each). This increased PO ATP response was observed in ∼40% of the patches examined for the present study and is identical to what we have reported previously as a “typical” PKC-mediated ATP response (Wilson et al., 1998; Magoski et al., 2002). C, In ∼25% of all patches, the response of the cation channel to ATP is absent altogether. The PO during the control period (0.074; top trace) shows no change when compared with the ATP period (0.073; bottom trace). The patch was held at –60 mV. D, In the final 30% or so of patches, the addition of ATP results in a reduction ofactivity. There is a decrease in PO when comparing the control period (0.019; top trace) to the ATP period (0.013; bottom trace). The patch was held at –60 mV. Amplitude and time base calibration bars also apply to B and C. E, A summary of animals (wide black bars) and patches (narrow gray bars) shows that animals either yield patches with cation channels that displayed an increase in PO to ATP or they yield patches with channels that lacked an increase in PO, i.e., did not respond or had a decrease in PO with ATP. The classification criteria is that an increased response had to show a > 25% increase in PO, a no-change response had to fall in between –25 and +25% change in PO, and a decreased response had to show a >25% decrease in PO. F, The mean percentage change in PO for the three categories of ATP response compiled in E. The increased PO ATP response averages an ∼180% elevation, the no-change PO ATP response averages an ∼4% rise, and the decreased PO ATP response averages an ∼40% drop in activity. All changes in PO are significantly different from one another (p < 0.001 or p < 0.05, one-way ANOVA and Student–Newman–Keuls multiple comparisons test). G, The channel shown in B is a true single channel, i.e., only one cation channel in the patch, which allows for kinetic analysis of its behavior. The single-channel closed and open dwell times are plotted as histograms along with the fit of a sum of exponentials, using the maximum likelihood estimator method and a simplex search. The time constants of the exponential fits are given in the inset of each graph. Under control conditions (top graphs), channel closed times are best fit by threee xponentials (τC1, τC2, and τC3) and the open times by two exponentials(τO1 and τO2). After the introduction of ATP (bottom graphs), the τC1 or τC2 change only to a small extent, whereas τC3 is markedly reduced (a nearly 5-fold decrease from ∼460 to ∼90 ms). Of the open times in the presence of ATP, τO2 displays a modest increase compared with τO1. This change in kinetic profile after ATP is qualitatively the same (a large change to τC3 and a smaller change to τO2) as what we have reported previously (Wilson et al., 1998; Magoski et al., 2002).

