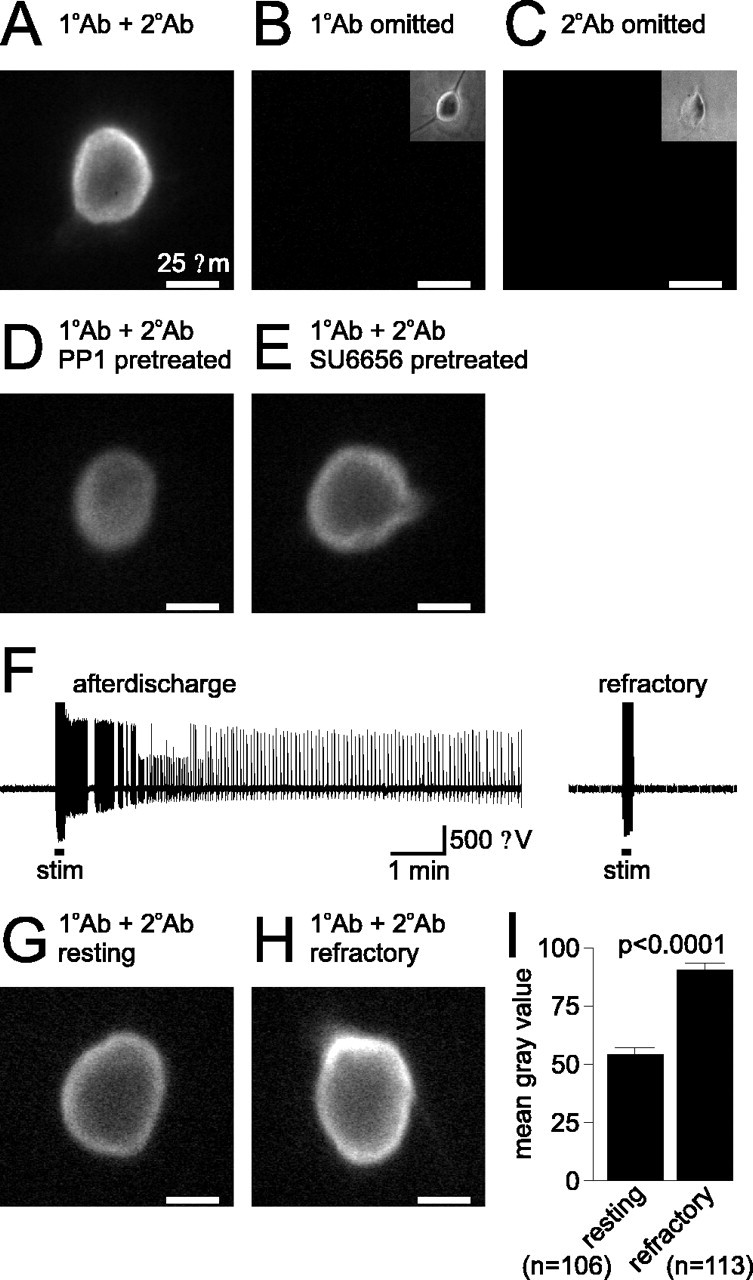
Figure 7.

Resting bag cell neurons have less tyrosine phosphorylation than refractory bag cell neurons. A, Fluorescence staining of cultured bag cell neurons for phosphotyrosine. Staining of a 1-d-old bag cell neuron with both primary antibody (1°Ab; monoclonal mouse anti-phosphotyrosine IgG) and secondary antibody (2°Ab; goat anti-mouse IgG FITC) shows a diffuse signal over the entire soma as well as a more prominent signal near the membrane edge. The scale bar applies to all pictures. B, If the 1°Ab is omitted and only the 2°Ab is used, the staining is absent. The inset in the top right corner shows the bright-field image of the neuron in the main picture. C, Similarly, if the 2°Ab is omitted and only the 1°Ab is used, there is no staining. The inset in the top right corner shows the bright-field image of the neuron in the main picture. D, Pretreatment of a 1-d-old bag cell neuron with 5 μm PP1 reduces the intensity of staining, particularly near the membrane edge. E, Although not quite as effective as PP1, pretreatment of a 1-d-old bag cell neuron with 5 μm SU6656 also reduces the level of detected phosphotyrosine. F, Extracellular recording from an intact bag cell neuron cluster in the abdominal ganglion. Left trace, Stimulation of the pleuroabdominal connective (stim; at bar, 2.5 ms pulses, 6 Hz, 10 V) initiates an after discharge. Right trace, Approximately 40 min later, the cluster has ceased to fire and is refractory, as a subsequent stimulus does not induce a second afterdischarge. G, Staining of a neuron cultured from a resting bag cell neuron cluster, i.e., a cluster that had not undergone an afterdischarge. Although the diffuse staining is evident, the presence of signal at the membrane edge is not so prominent. H, Staining of a neuron cultured using a refractory bag cell neuron cluster, i.e., a cluster that had been stimulated to fire an afterdischarge. Both the diffuse and membrane edge signals are conspicuous, and although these signals were certainly greater than those from the resting neurons, they were only slightly higher than what was observed in the 1-d-old cultured neurons. I, Summary data for the difference in fluorescence signal intensity, as measured using regions of interests over the entire neuronal somata and reported as the mean gray value. The signal from resting neurons is significantly different compared with refractory neurons (p < 0.0001, Student's t test).
