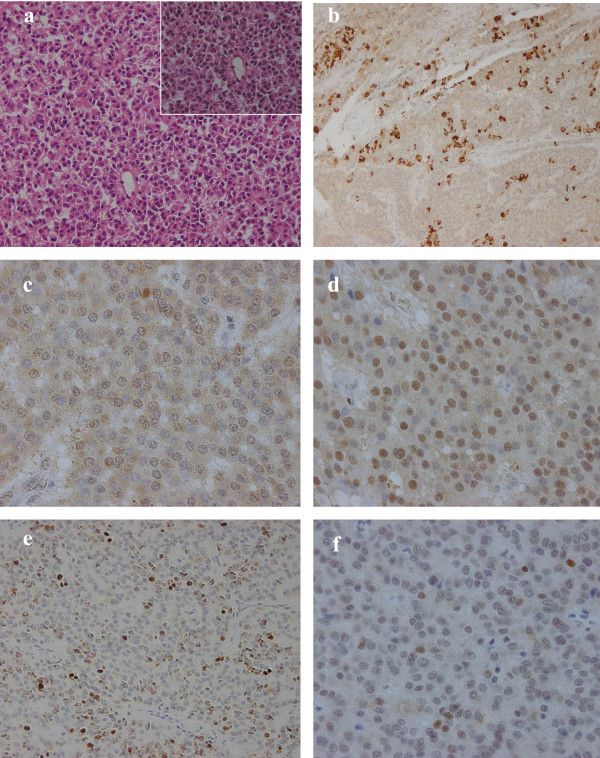
Figure 3.
Pathological findings. HE staining and Immunohistochemistry pictures: a; HE staining of the tumor (×200), inset a magnification of ×400, b; IHC of chromograninA, which shows strong and diffuse staining in the tumor cytoplasms (×200) c; IHC of hASH1, which shows diffuse staining in the tumor cytoplasms and also in some nucleus (×400) d; IHC of NeuroD, which shows strong and diffuse staining in the tumor nucleus (×400) e; IHC of MIB-1, which shows a high labeling index (×200) f; IHC of p53, which shows partial staining in the tumor nucleus (×400).

