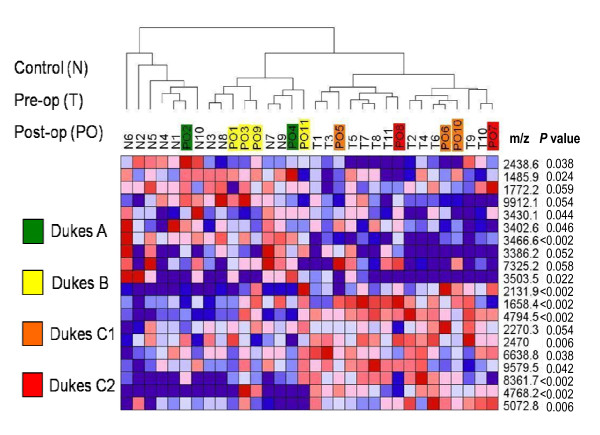
Figure 1.
Classification of spectra from post-operative sera by hierarchical cluster analysis. The top 20 ranked protein peaks that discriminate normal from pre-operative CRC sera were used in hierarchical cluster analysis employing Spearman's rank correlation as column distance measure with pair-wise complete-linkage as the clustering method. The identities of serum specimens (see Table 1) are depicted in the dendrogram (N = normal, T = pre-operative cancer, PO = post-operative cancer). The Dukes' stage of each patient prior to surgery is depicted in the respective post-operative (PO) sample. The m/z values and P values (student's t-test) of discriminating peaks are shown in the right-hand column.

